. 2025 Sep 29;16(1):8341.
doi: 10.1038/s41467-025-64249-6.

Uncertainty-aware ensemble of foundation models differentiates glioblastoma from its mimics

Affiliations

Uncertainty-aware ensemble of foundation models differentiates glioblastoma from its mimics

Junhan Zhao et al. Nat Commun. .

Abstract

Accurate pathological diagnosis is crucial in guiding personalized treatments for patients with central nervous system cancers. Distinguishing glioblastoma and primary central nervous system lymphoma is particularly challenging due to their overlapping pathology features, despite the distinct treatments required. To address this challenge, we establish the Pathology Image Characterization Tool with Uncertainty-aware Rapid Evaluations (PICTURE) system using 2141 pathology slides collected worldwide. PICTURE employs Bayesian inference, deep ensemble, and normalizing flow to account for the uncertainties in its predictions and training set labels. PICTURE accurately diagnoses glioblastoma and primary central nervous system lymphoma with an area under the receiver operating characteristic curve (AUROC) of 0.989, with the results validated in five independent cohorts (AUROC = 0.924-0.996). In addition, PICTURE identifies samples belonging to 67 types of rare central nervous system cancers that are neither gliomas nor lymphomas. Our approaches provide a generalizable framework for differentiating pathological mimics and enable rapid diagnoses for central nervous system cancer patients.


Conflict of interest statement

Competing interests: K.-H.Y. is an inventor of U.S. Patent 10,832,406. This patent is assigned to Harvard University and is not directly related to this manuscript. K.-H.Y. was a consultant for Curatio.DL (not related to this work). All other authors have nothing to disclose.

Figures

Fig. 1
Fig. 1. Overview of the pathology image characterization tool with uncertainty-aware rapid evaluations (PICTURE).
A We collected 2141 pathology slides of formalin-fixed paraffin-embedded (FFPE) and frozen section CNS tissues from five medical centers, including Brigham and Women’s Hospital, Mayo Clinic, the Hospital of the University of Pennsylvania, Taipei Veterans General Hospital, and the Medical University of Vienna. B We employed pathology foundation models (CTransPath, UNI, Lunit, Phikon, Virchow2, CONCH, GPFM, mSTAR, and CHIEF) to extract concise representations of high-resolution pathology image features. These feature extractors were trained on diverse datasets without labels of pathology diagnosis. C To enhance the model’s generalizability across patient populations, we curated additional pathology images from neuropathology publications and incorporated them into model training and uncertainty quantification processes,–. D We focused on the classification of glioblastoma and primary CNS lymphoma (PCNSL) due to their clinical significance. We partitioned the development dataset (i.e., Mayo Clinic) into fivefolds. PICTURE integrates three distinct uncertainty quantification methods: (U.1) Bayesian inference, which leverages prototypical images to detect atypical pathology profiles; (U.2) deep ensembling, which aggregates predictions from multiple foundation models and refines whole-slide predictions by excluding uncertain tiles; and (U.3) normalizing flow, which identifies central nervous system (CNS) cancer types not present in the training dataset. The graphics in (A–C) and the layout of (D) were created in BioRender. Zhao, J. (2025) https://BioRender.com/v04o604.
Fig. 2
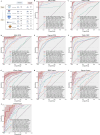
Fig. 2. PICTURE successfully distinguishes glioblastoma from primary central nervous system lymphoma (PCNSL) across diverse tissue types and clinical sites.
The red line indicates the estimated AUROC of PICTURE; the shaded region shows the 95% confidence interval derived from 1000 bootstrap samples. P-values were calculated using one-sided bootstrap hypothesis tests. A, B We developed PICTURE using digital pathology slides from the Mayo Clinic and evaluated its performance on the held-out FFPE test set, PICTURE achieved AUROCs comparable to all foundation models. To assess generalizability, we validated PICTURE on four independent cohorts. Sample counts per site are shown. C–F PICTURE demonstrated consistently high performance on FFPE samples from independent cohorts: at UPenn, it achieved an AUROC of 0.996, outperforming UNI (0.976, P < 0.001) and performing comparably to Virchow2 (0.995, P = 0.243); at BWH, it reached 0.987, significantly higher than UNI (0.977, P = 0.025) and Virchow2 (0.975, P = 0.014); in Vienna, it attained 0.992, outperforming UNI (0.966, P < 0.001) and Virchow2 (0.964, P < 0.001); and at TVGH, it achieved 0.992, exceeding CONCH (0.982, P = 0.001) and Virchow2 (0.980, P < 0.001). G–J PICTURE enabled real-time intraoperative diagnostic support using frozen section slides. At UPenn, it reached 0.958, significantly outperforming the Swin Transformer (0.898, P < 0.001) and showing modest improvement over CONCH (0.946, P = 0.067). At BWH, both PICTURE and CONCH achieved 0.987 (P = 0.505), outperforming CHIEF (0.971, P < 0.001). In Vienna, PICTURE reached 0.988, surpassing UNI (0.966, P < 0.001) and Virchow (0.940, P < 0.001). At TVGH, PICTURE attained 0.924, performing comparably to CONCH (0.919, P = 0.427) and better than CTransPath (0.896, P = 0.672). Asterisks indicate significantly better performance by PICTURE (*P < 0.05; **P < 0.01; ***P < 0.001). Tissue slide illustrations in (A) were created in BioRender. Zhao, J. (2025) https://BioRender.com/j32r478.
Fig. 3
Fig. 3. PICTURE highlighted cellular changes indicative of glioblastoma and primary central nervous system lymphoma (PCNSL) in formalin-fixed paraffin-embedded (FFPE) and frozen section tissues.
Red and blue regions denote areas highly indicative of PCNSL and glioblastoma, respectively. In the uncertainty heatmaps, brighter regions correspond to areas where the model exhibits greater confidence in its prediction. The slides are reviewed by six pathologists independently (T.M.P., A.W., S.C.L., N.S., J.A.G., M.P.N.). a PICTURE predictions of four representative glioblastoma FFPE samples. The PICTURE model highlighted regions with compact tumor and spindle cells as strong indicators of glioblastoma. Regions with polymorphous nuclei, blood, and surgical material obtained low confidence scores. In addition, perivascular inflammation and thrombosis are highlighted by PICTURE. b PICTURE predictions of four representative PCNSL FFPE samples. Cell-dense regions showing typical lymphoid morphology and scattered “tangible body macrophages” in a “starry sky” pattern are highlighted with high confidence for differentiating PCNSL from primitive glioblastoma mimics. Regions with pronounced squeezing artifacts, such as hemorrhage, are marked as areas with low diagnostic confidence. c PICTURE predictions for two representative glioblastoma frozen section samples. PICTURE associated regions with dense glioma cells, edemas, and necrosis with high prediction confidence. Low-confidence regions have lower cellularity but exhibit microvascular proliferation. d PICTURE predictions for two representative PCNSL frozen section samples. PICTURE marked compact tumors with clear intercellular separation as low confidence, and regions with clustered compact tumors received high confidence in the diagnostic prediction. PICTURE’s uncertainty mechanism can correct inaccurate preliminary direct model predictions in difficult cases, highlighting malignant cells. Characteristic features include angiocentric malignant cells and perivascular cuffs. Scale bars: 1 mm.
Fig. 4
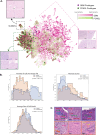
Fig. 4. PICTURE quantifies the uncertainty in diagnosing whole-slide pathology images of CNS cancers.
A Typical pathological patterns of glioblastoma and PCNSL possess distinct image features extracted by foundation models. This figure panel shows the UMAP projection of PICTURE’s tile-level (CTransPath) image feature space using 149,914 samples from the Mayo Clinic. PICTURE quantified the epistemic uncertainty of its predictions by comparing the morphological similarities between the image under evaluation and prototypical images from the literature. Glioblastoma and PCNSL pathology images with high certainty in their diagnoses occupied distinct feature space. Images with low certainty (i.e., high uncertainty) reside in similar regions. By excluding training instances with uncertainty scores higher than the median score, we obtained a generalizable model with high classification performance in all four external validation cohorts. The gradient in color saturation shows the level of uncertainty associated with each sample. Darker hues represent high certainty (i.e., low uncertainty). The star signs in this figure panel mark the prototypical histopathology images obtained from the literature, which guides our uncertainty-aware model training process. The box with a black outline shows a specimen with areas of collagenous tissue consistent with dura mater. This tissue is eosinophilic with wavy architecture and includes nonviable muscle fibers. B PICTURE identified distinct tissue characteristics of glioblastoma and PCNSL. This analysis was performed on the FFPE cohorts from BWH and UPenn, comprising 1,213,656 glioblastoma and 365,779 PCNSL image tiles. Glioblastoma samples are more likely to contain regions with necrosis, and the cell nuclei of glioblastoma have more heterogeneous sizes compared with PCNSL samples. PCNSL samples contain denser cells on average. The reported values are from two-sided Mann–Whitney U tests with no corrections as the statistical tests were used to describe group differences rather than to establish definitive significance. C Six selected examples of regions receiving highly confident predictions from PICTURE. PCNSL samples (blue outlines) contain distinct pathology patterns, including vessels surrounded by tumor cells (red arrows), macrophages amidst tumor cells (blue arrows), and malignant hematopoietic cells (green arrows). Glioblastoma samples (orange outlines) show microvascular proliferation (pink arrows), infiltrating glioma cells (purple arrows), perivascular tumors (orange arrows), abnormal vessels, as well as hemorrhage (yellow arrows). Scale bars: 100 μm.
Fig. 5
Fig. 5. PICTURE detected pathology manifestations not represented in the training set.
A The 2021 WHO Classification of Tumors of the Central Nervous System defines 109 types of CNS cancers, and most of these cancer types have an incidence rate lower than 0.1 per 100,000 person-years. We employed the uncertainty quantification capability of PICTURE to identify normal tissues and CNS tumor types (non-glioblastoma and non-PCNSL; diagnostic categories not included in the training dataset). B A PICTURE model trained to recognize glioblastoma and PCNSL successfully identified non-glioblastoma and non-PCNSL samples with an AUROC of 0.919, significantly outperforming existing OOD detection methods such as Monte Carlo dropout (AUROC = 0.666, P-value < 0.001) and deep ensemble (AUROC = 0.554, P-value < 0.001). P-values were determined by one-sided bootstrap significance tests (N = 1000). The shaded areas show the 95% confidence intervals estimated by 1000 bootstrap samples, and the solid lines represent the average sensitivity and specificity. C UMAP visualization of the image feature space in the test set showed that in-distribution glioblastoma (red isolines), PCNSL (blue isolines), and out-of-distribution (orange isolines) samples occupied distinct feature spaces. The color of the dots shows the epistemic certainty measurement of a given sample quantified by PICTURE, and the colored isolines show the kernel density distribution of each tumor type. Lighter dots represent samples with high levels of certainty. Samples represented by darker colors have lower certainty scores according to the PICTURE model, which was trained with in-distribution cases only. Samples with certainty scores lower than 0.5 are predominantly (84.7%) non-glioblastoma and non-PCNSL cases, while the remaining 15.3% consist of misidentified GBM (75.3%) and PCNSL (24.7%) cases.

References

    1. Ostrom, Q. T., Cioffi, G., Waite, K., Kruchko, C. & Barnholtz-Sloan, J. S. CBTRUS statistical report: primary brain and other central nervous system tumors diagnosed in the United States in 2014-2018. Neuro Oncol.23, iii1–iii105 (2021). - PMC - PubMed
    1. Kurdi, M. et al. Simple approach for the histomolecular diagnosis of central nervous system gliomas based on 2021 World Health Organization Classification. World J. Clin. Oncol.13, 567–576 (2022). - PMC - PubMed
    1. Louis, D. N. et al. The 2021 WHO classification of tumors of the central nervous system: a summary. Neuro Oncol.23, 1231–1251 (2021). - PMC - PubMed
    1. Bondy, M. L. et al. Brain tumor epidemiology: consensus from the brain tumor epidemiology consortium. Cancer113, 1953–1968 (2008). - PMC - PubMed
    1. Giese, A. & Westphal, M. Treatment of malignant glioma: a problem beyond the margins of resection. J. Cancer Res. Clin. Oncol.127, 217–225 (2001). - PMC - PubMed

LinkOut - more resources