. 2025 Sep 29;16(1):8555.
doi: 10.1038/s41467-025-64229-w.

Isoprene chemistry under upper-tropospheric conditions

Douglas M Russell  1 Felix Kunkler  2 Jiali Shen  3   4 Matthias Kohl  2 Jenna DeVivo  5   6 Nirvan Bhattacharyya  5   6 Christos Xenofontos  7 Hannah Klebach  8 Lucía Caudillo-Plath  8 Mario Simon  8 Emelda Ahongshangbam  3   9 João Almeida  10   11 Antonio Amorim  11   12 Hannah Beckmann  13 Mattia Busato  10 Manjula R Canagaratna  14 Anouck Chassaing  15 Romulo Cruz-Simbron  16   17 Lubna Dada  18 Philip Holzbeck  2 Bernhard Judmaier  19 Milin Kaniyodical Sebastian  20 Paap Koemets  13 Timm Krüger  8 Lu Liu  18 Monica Martinez  2 Bernhard Mentler  19 Aleksandra Morawiec  21 Antti Onnela  10 Tuukka Petäjä  3 Pedro Rato  8   10 Mago Reza  16   17 Samuel Ruhl  2 Wiebke Scholz  19 Eva Sommer  10   21 António Tomé  22 Yandong Tong  16   17 Jens Top  18 Nsikanabasi Silas Umo  20   23 Gabriela R Unfer  24 Ryan X Ward  25 Jakob Weissbacher  19 Boxing Yang  18 Wenjuan Yu  3 Marcel Zauner-Wieczorek  8 Imad Zgheib  26 Jiangyi Zhang  3 Zhensen Zheng  19   27 Imad El Haddad  18 Richard C Flagan  25 Armin Hansel  19 Heikki Junninen  13 Markku Kulmala  3   4   28   29 Katrianne Lehtipalo  3   30 Jos Lelieveld  2   7 Ottmar Möhler  20 Siegfried Schobesberger  31 Rainer Volkamer  16   17 Paul M Winkler  21 Douglas R Worsnop  3   14 Theodoros Christoudias  7 Andrea Pozzer  2   7 Neil M Donahue  5   6   32 Hartwig Harder  2 Jasper Kirkby  8   10 Xu-Cheng He  3   33 Joachim Curtius  34
Affiliations

Isoprene chemistry under upper-tropospheric conditions

Douglas M Russell et al. Nat Commun. .

Abstract

Isoprene (C5H8) is the non-methane hydrocarbon with the highest emissions to the atmosphere. It is mainly produced by vegetation, especially broad-leaved trees, and efficiently transported to the upper troposphere in deep convective clouds, where it is mixed with lightning NOx. Isoprene oxidation products drive rapid formation and growth of new particles in the tropical upper troposphere. However, isoprene oxidation pathways at low temperatures are not well understood. Here, in experiments at the CERN CLOUD chamber at 223 K and 243 K, we find that isoprene oxygenated organic molecules (IP-OOM) all involve two successive OH oxidations. However, depending on the ambient concentrations of the termination radicals ( HO 2 , NO , and NO 2 ), vastly-different IP-OOM emerge, comprising compounds with zero, one or two nitrogen atoms. Our findings indicate high IP-OOM production rates for the tropical upper troposphere, mainly resulting in nitrate IP-OOM but with an increasing non-nitrate fraction around midday, in close agreement with aircraft observations.


Conflict of interest statement

Competing interests: The authors declare no competing interests.

Figures

Fig. 1
Fig. 1. Schematic of OH initiated isoprene oxidation under daytime upper-tropospheric conditions.
Isoprene is oxidised by OH to form a peroxy radical, ISOPOO (C5H9O3), which can be terminated by HO2,NO or NO2 to form first-generation intermediates ISOPOOH (isoprene hydroxy hydroperoxide, C5H10O3), IHN (isoprene hydroxy nitrate, C5H9NO4), and IHPN (isoprene hydroxy peroxy nitrate, C5H9NO5), respectively. The isoprene backbone contains two C=C bonds, therefore, the first-generation intermediates react with OH to form peroxy radicals, which are terminated by HO2,NO or NO2 to produce six distinct second-generation species (C5H12O6, C5H11NO8, C5H10N2O10, C5H10N2O9, C5H10N2O8 and C5H11NO7), each with hydroperoxide groups, nitrate groups and peroxynitrate groups depending on which radicals led to termination. The red, blue and purple arrows represent, respectively, OH then HO2,OH then NO, and OH then NO2 reactions. This mechanism augments existing isoprene mechanisms to include peroxynitrates, a potentially important upper-tropospheric pathway. There are additional isomers that exist beyond those shown, and they follow similar chemical pathways.
Fig. 2
Fig. 2. Composition and yield of IP-OOM at 223 K.
a Normalised fraction of C5 IP-OOM (nC=5,nOeff>3) based on differing oxidation levels versus OH concentration. Isoprene is a diene, thus two OH additions can occur to form saturated products with −OH, −OOH, −ONO2 and −O2NO2 functionality. Within this oxidation process, unsaturated products are also produced. These compounds have either retained a C=C bond, isomerised to contain a carbonyl group, C=O, or formed an epoxide, C-O-C. Saturation levels are determined by the hydrogen and nitrogen content: Saturated: nN = 0, nH = 12; nN = 1, nH = 11; nN = 2, nH = 10. Unsaturated: nN = 0, nH = 10; nN = 1, nH = 9. Other refers to the remaining C5 IP-OOM, which includes radicals, H-abstraction products and products from nitrate and ozone oxidation. Circles and squares represent runs with and without NOx, respectively. The orange dashed line fits the data in the form Saturated fraction = 0.32 × log[OH] − 1.81, the other fits are listed in Table S3. b total measured IP-OOM (grey) with (circles) and without NOx (squares) and IP0N (red cross), IP1N (pink cross) and IP2N (blue cross) versus reacted IP-OOM precursors, see SI section C for individual x-axis definitions. IP-OOM: nC> 3, nOeff> 3; IP0N,IP1N and IP2N are all subsets of IP-OOM, where nN = 0, nN = 1 and nN = 2, respectively. The dashed lines indicate that the yield of IP-OOM is between 50 and 100%, and between 25 and 50% for each IP0,1,2N. Using linear regression, the average yield of IP-OOM is 68%. For the individual subsets, specific IP-OOM precursors can be used to determine more accurate yields as described in SI section C. Using these definitions, the average yields are 36%, 31%, 42% for IP0N,IP1N and IP2N, respectively.
Fig. 3
Fig. 3. Molecular composition for different radical dominant cases.
Mass defect (difference from integer mass) versus mass-to-charge for three radical distribution cases: a HO2 case, b NO case and c NO2 case. The data points are coloured by the number of oxygen atoms in the molecule and the outlines are coloured by the number of nitrogen present: N = 0  → black, N = 1  → red, N = 2  → blue. The symbol area is proportional to the log of the normalised species concentration. For concentrations 108cm-3, symbols are faded to the background (C4 H6O for all cases and C5H10O3 for HO2 case). Only concentrations above 5×105cm-3 are shown in accordance with the highest limit of detection. This is a combination of three mass spectrometers applying NO3−, Br and NH4+ ionisation methods.
Fig. 4
Fig. 4. Second-generation products as a function of radical ratios.
The normalised fraction (Eq. 5) of the three cross-branch products is plotted as a function of the respective branch radical ratios. For example, a shows the double NO termination product C5H10N2O8 (blue), the mixed product C5H10N2O9 (purple), and the double NO2 termination product C5H10N2O10 (red) normalised to the sum of all three, plotted against the NO2:NO ratio. b repeats the same treatment for HO2:NO and the second-generation products C5H10N2O8 (blue), C5H11NO7 (purple) and C5H12O6 (red), and c presents C5H10N2O10 (blue), C5H11NO8 (purple) and C5H12O6 (red) as a function of HO2:NO2 ratios. Circles represent data at 223 K, and triangles at 243 K. Sigmoid and Gaussian curves have been fitted through the 223 K data and the standard deviation has been shaded, to represent uncertainty in the fit. Each data point in Fig. 4 is an averaged period of a steady-state chemistry stage achieved in CLOUD and vertical dashed lines indicate the point of equal termination for each branch, 3.51, 0.41 and 0.09 for (a, b, c), respectively. All second-generation concentrations are obtained from the NO3-CIMS.
Fig. 5
Fig. 5. Aircraft observation and laboratory comparison of the second-generation distribution as a function HO2:NO.
Solid lines represent the experimental fits of C5H10N2O8 (blue), C5H11NO7 (purple) and C5H12O6 (red) from Fig. 4b of the CLOUD experiment, 223 K and 965 mbar. Square markers indicate atmospheric aircraft observations (CAFE) from Curtius et al., specifically T4–T9, at 213 K and 187 mbar. To adjust for the pressure difference (see Fig. S8), circles (213 K and 950 mbar) represent CAFE T4–T9 periods, shifted by a factor of two in HO2:NO (CAFE (adj)). Error bars represent 1σ accuracy of the HO2 measurement.
Fig. 6
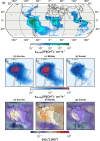
Fig. 6. Global simulation of upper-tropospheric IP-OOM chemistry.
a The global daytime reactivity of isoprene + OH. Using annually averaged daytime isoprene and OH concentrations from the EMAC global model and a reaction rate coefficient kIP=2.7×10⁻¹¹e390Tcm3s-1. Focusing on the Amazon rainforest, isothermal-surface plots depict the reactivity of isoprene with OH at three daytime periods b Sunrise, c Midday and d Sunset. The HO2:NO ratio at three daytime periods e Sunrise, f Midday and g Sunset is also plotted for each daytime period. A hashed grid (masking insufficient oxidation) has been added so to highlight regions with isoprene and OH levels high enough that sufficient oxidation could occur: isoprene  >2.4 ×107cm-3 (223 K, 230 mbar) and OH  >6 ×105cm-3 (223 K, 230 mbar). Midday is defined using the hour of highest shortwave flux at the top of the atmosphere, whereas sunrise and sunset are defined when the shortwave flux is closest to a quarter of the maximum shortwave flux. All data are annually averaged isothermal-surface plots at the temperature of 223 K from the global model (EMAC), ranging between 200 and 300 hPa and (−51.3°, 51.3°) latitude. A detailed description of the model conditions is presented in ‘Methods’. The map in the figures were made with Natural Earth.

References

    1. Guenther, A. B. et al. The model of emissions of gases and aerosols from nature version 2.1 (MEGAN2.1): an extended and updated framework for modeling biogenic emissions. Geosci. Model Dev.5, 1471–1492 (2012).
    1. Ying, Q., Li, J. & Kota, S. H. Significant contributions of isoprene to summertime secondary organic aerosol in Eastern United States. Environ. Sci. Technol.49, 7834–7842 (2015). - PubMed
    1. Pressley, S. et al. Long-term isoprene flux measurements above a northern hardwood forest. J. Geophys. Res. Atmos.110, D07301 (2005).
    1. Potosnak, M. J. et al. Isoprene emissions from a tundra ecosystem. Biogeosciences10, 871–889 (2013).
    1. Wennberg, P. O. et al. Gas-phase reactions of isoprene and its major oxidation products. Chem. Rev.118, 3337–3390 (2018). - PubMed

LinkOut - more resources