

Comparative analysis of illumina and oxford nanopore sequencing platforms for 16S rRNA profiling of respiratory microbial communities
- PMID: 41023034
- PMCID: PMC12480654
- DOI: 10.1038/s41598-025-18768-3
Comparative analysis of illumina and oxford nanopore sequencing platforms for 16S rRNA profiling of respiratory microbial communities
Abstract
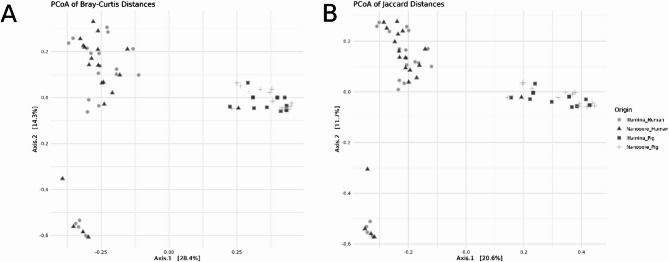
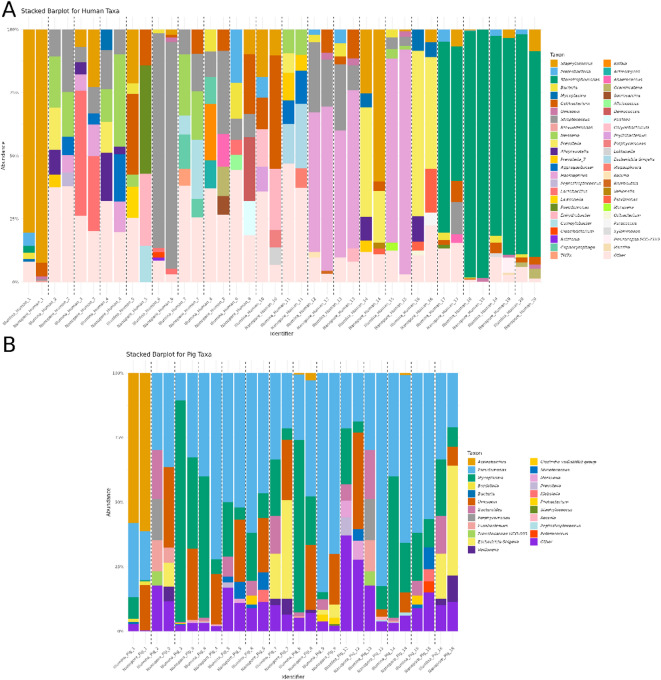
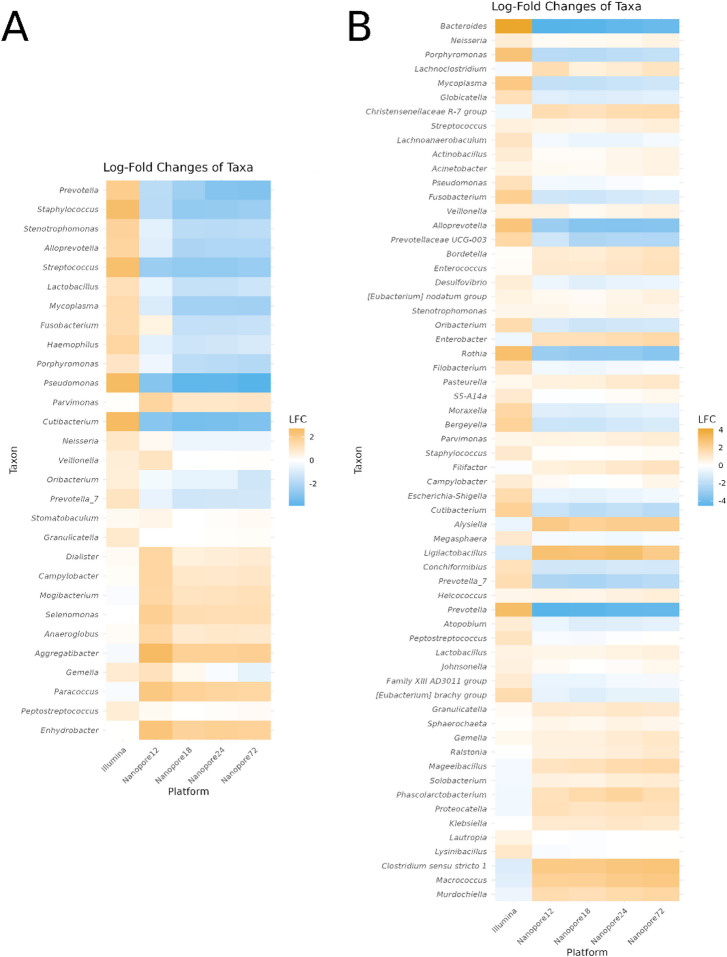
The respiratory microbiome plays a crucial role in health and disease, necessitating accurate characterization through high-throughput sequencing technologies. This study provides a comparative analysis of Illumina NextSeq and Oxford Nanopore Technologies (ONT) sequencing platforms for 16 S rRNA profiling of respiratory microbial communities. Illumina sequencing, known for its high accuracy and short-read lengths (~ 300 bp), is widely used for genus-level microbial classification but struggles with species-level resolution due to its limited read length. In contrast, ONT generates full-length 16 S rRNA reads (~ 1,500 bp), enabling higher taxonomic resolution but historically exhibiting higher error rates (5-15%). Analysis of alpha and beta diversity indicated that Illumina captured greater species richness, while community evenness remained comparable between platforms. Beta diversity differences were significant in pig samples but not in human samples, suggesting that sequencing platform effects are more pronounced in complex microbiomes. Taxonomic profiling revealed that Illumina detected a broader range of taxa, while ONT exhibited improved resolution for dominant bacterial species. ANCOM-BC2 differential abundance analysis highlighted platform-specific biases, with ONT overrepresenting certain taxa (e.g., Enterococcus, Klebsiella) while underrepresenting others (e.g., Prevotella, Bacteroides). These findings emphasize that platform selection should align with study Objective: Illumina is ideal for broad microbial surveys, whereas ONT excels in species-level resolution and real-time applications. Future research should explore hybrid sequencing approaches to leverage the strengths of both technologies, thereby improving microbiome characterization in both clinical and preclinical settings.
© 2025. The Author(s).
Conflict of interest statement
Declarations. Human ethics: This study involving human participants was approved by the Internal Review Board of Hospital Clinic, Barcelona (registry number HCB/2021/0343). Written informed consent was obtained from all participants. All methods involving human subjects were performed in accordance with the relevant institutional guidelines and regulations. Competing interests: A. Torres has received grants from MedImmune, Cubist, Bayer, Theravance and Polyphor, and personal fees as an advisory board member from Bayer, Roche, The Medicines CO and Curetis. He has received bureau fees for keynote speaker presentations from GSK, Pfizer, Astra Zeneca and Biotest Advisory Board, but these were not associated with the study described in this paper. All the remaining authors declare no conflict of interest. Animal ethics: Animal experiments were conducted in accordance with the European guidelines for the care and use of laboratory animals. The study was approved by the Institutional Animal Care and Use Committee of the University of Barcelona (approval number 159/20). All animal procedures were performed in accordance with institutional and national regulations, and the study is reported in accordance with the ARRIVE guidelines.
Figures

References
-
- Earl, J. P. et al. Oct., ‘Species-level bacterial community profiling of the healthy sinonasal microbiome using Pacific Biosciences sequencing of full-length 16S rRNA genes 06 Biological Sciences 0604 Genetics 06 Biological Sciences 0605 Microbiology’, Microbiome, vol. 6, no. 1, pp. 1–26, (2018). 10.1186/S40168-018-0569-2/METRICS - PMC - PubMed
Publication types
MeSH terms
Substances
Grants and funding
LinkOut - more resources
Full Text Sources
