. 2025 Dec;5(12):2380-2398.
doi: 10.1038/s43587-025-00961-8. Epub 2025 Sep 29.

Elastin-derived extracellular matrix fragments drive aging through innate immune activation

Affiliations

Elastin-derived extracellular matrix fragments drive aging through innate immune activation

Junzhi Yi et al. Nat Aging. 2025 Dec.

Abstract

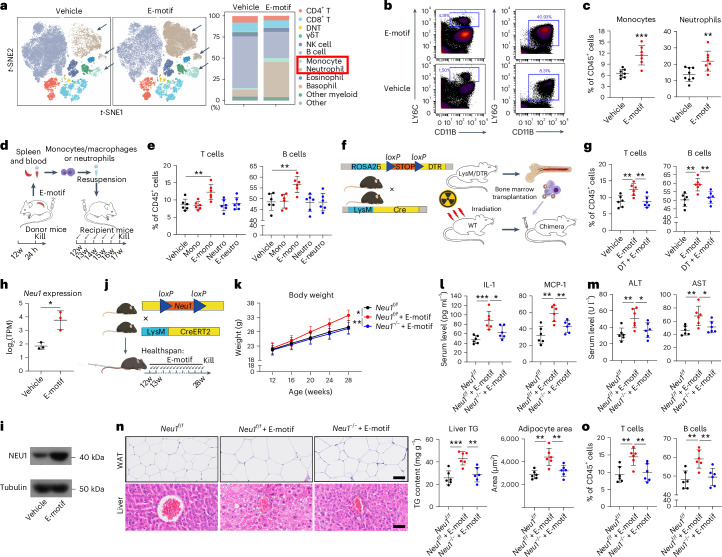
The roles of cells in systemic aging have been systematically investigated, while the roles of the extracellular matrix (ECM) and its degradation have been largely overlooked. Herein, we show that the serum contents of elastin-, hyaluronic acid- and fibronectin-derived fragments are all positively correlated with age. Elastin-derived fragments exhibited the most potent lifespan-shortening effects in mice and a positive correlation with various aging indicators in a human cohort (n = 1,068). Mechanistically, the VGVAPG oligopeptide (E-motif) in elastin-derived fragments activated monocytes and macrophages through NEU1, a component of the elastin receptor complex, which consequently caused an inflammatory response. Therapeutically, a NEU1 inhibitor extended lifespan by up to 17% in wild-type naturally aged mice and alleviated aging-related phenotypes in wild-type mice, immune-humanized mice and pigs. This study uncovers that degraded ECM acts as a circulating driver of aging, providing an anti-aging intervention strategy focused on particular elastin fragment signals.


Conflict of interest statement

Competing interests: The authors declare no competing interests.

Figures

Fig. 1
Fig. 1. Matrikines are differentially associated with aging.
a, Correlation between the serum levels of different matrikines (ELN, HA, FN and COL fragments; measured by ELISA) and age in humans of varying ages. The red dashed line represents the linear regression line (n = 100 per group; P < 0.0001 for each group). b, Positive correlation between the serum levels of different matrikines (ELN, HA, FN and COL fragments; measured by ELISA) and age in mice across five different age points (3, 9, 15, 21 and 27 months). The red dashed line represents the linear regression line (ELN, COL: n = 32, HA, FN: n = 31; P < 0.0001 for each group). c, Schematic diagram illustrating the experimental design of injecting matrikines into mice through the tail vein to study their effects on healthspan and lifespan. w, weeks; Kill, time point of animal killing. Illustration was created using FigDraw. d, Survival curves of mice injected with vehicle or matrikines (n = 4 per group; ELN versus vehicle P = 0.0266 by log-rank test and P = 0.0328 by Gehan–Breslow–Wilcoxon test). e, Body weight changes in mice injected with vehicle (PBS) or matrikines (n = 4 per group over time; ELN versus vehicle: at 28 weeks P = 0.0105, at 32 weeks P = 0.0011, at 36 weeks P = 0.0003). f, Percentage of fat tissue and lean tissue relative to body weight in mice treated with vehicle or ELN, HA, FN and COL fragments twice a week for 24 weeks (n = 4 per group; fat tissue: ELN versus vehicle P = 0.0170; lean tissue: ELN versus vehicle P = 0.0198, FN versus vehicle P = 0.0469). g, Schematic representation of the treadmill test (left) and analysis of the number of electric shocks administered (right) (n = 4 per group; ELN versus vehicle P = 0.0291, HA versus vehicle P = 0.0247). h, Serum levels of the hepatic markers AST and ALT (n = 4 per group; AST: ELN versus vehicle P = 0.0329, HA versus vehicle P = 0.0451; ALT: ELN versus vehicle P = 0.0076). i, Serum levels of the inflammatory cytokines IL-1 and TNF (n = 4 per group; IL-1: ELN versus vehicle P = 0.0130; TNF: ELN versus vehicle P = 0.0017, HA versus vehicle P = 0.0129). j, qPCR analysis showing the expression of P16INK4A, P21, P53, Il1b, Il6 and Tnf in various organs (liver, heart, kidney, spleen, WAT, muscle and lung) of mice. The heatmap illustrates the fold changes relative to the mean values of the vehicle group (n = 4 per group). *P < 0.05, **P < 0.01, ***P < 0.001 compared to the vehicle group. Statistical tests: Pearson correlation coefficients with a two-tailed 95% confidence interval (a, b); log-rank test and Gehan–Breslow–Wilcoxon test (d); two-way ANOVA (e); unpaired two-tailed Student’s t test (equal variance) or unpaired two-tailed t test with Welch’s correction (unequal variance) with a 95% confidence interval (fj). Data are presented as mean values ± s.d. (ei). Source data
Fig. 2
Fig. 2. E-motif induces an unhealthy and shorter lifespan.
a, Schematic diagram illustrating the experimental design of injecting E-motif or poly(A/K) into the tail vein of mice to study their effects on lifespan and healthspan. Illustration was created using FigDraw. b, Survival curves of mice injected with vehicle, E-motif or poly(A/K) (vehicle: n = 21, E-motif: n = 22, poly(A/K): n = 25; E-motif versus vehicle: P < 0.0001 by log-rank test and P < 0.0001 by Gehan–Breslow–Wilcoxon test, poly(A/K) versus vehicle: P = 0.4473 by log-rank test and P = 0.7417 by Gehan–Breslow–Wilcoxon test). c, Body weight changes in mice over time (n = 11 per group over time; at 20 weeks P = 0.0314, at 24 weeks and after P < 0.0001). d,e, Percentages of fat tissue (d) and lean tissue (e) relative to body weight at the experimental endpoint (n = 11 per group; fat tissue: E-motif versus vehicle P < 0.0001, lean tissue: E-motif versus vehicle P = 0.0009). f, Schematic representation of the treadmill test (left) and analysis of the number of electric shocks administered (right) (n = 7 per group; E-motif versus vehicle P = 0.0025). g, Open field test, including movement trajectories (left), total movement distance (center) and mean speed (right) (n = 6 per group; total movement distance: E-motif versus vehicle P = 0.0054, mean speed: E-motif versus vehicle P = 0.0058). h, P16 gene expression pattern in P16-3MR mice, which carry the luciferase gene expressed under the control of the P16 regulatory region, allowing spatial visualization of P16-positive senescent cells in vivo through bioluminescence imaging. Left, imaging of mice; right, quantification at the experimental endpoint (vehicle: n = 4, E-motif: n = 3; E-motif versus vehicle P = 0.0348). i, Left, representative X-ray images of mice, with black lines indicating how the kyphosis index was measured; right, quantitative analysis of the kyphosis index (n = 6 per group; E-motif versus vehicle P = 0.0450). j, Schematic representation of serum extraction from the peripheral blood of mice. k, Blood biochemical tests for AST and ALT levels (n = 6 per group; AST: E-motif versus vehicle P = 0.0065, ALT: E- motif versus vehicle P = 0.0076). l, Serum levels of the inflammatory markers MCP-1, IL-1 and TNF (MCP-1: n = 9 per group, IL-1 and TNF: n = 8 per group; MCP-1: E-motif versus vehicle P = 0.0006, IL-1: E-motif versus vehicle P = 0.0003, TNF: E-motif versus vehicle P = 0.0024). m, Representative images of H&E staining of WAT (left) with quantification of the adipocyte area (right) (n = 8 per group; E-motif versus vehicle P = 0.0008). n, Representative images of H&E staining of skin tissue (left) with quantification of epidermal thickness (right) (vehicle: n = 8, E-motif: n = 7; E-motif versus vehicle P = 0.0001). o, Representative images of H&E staining of liver tissue (left) with quantification of TG content (right) (n = 7 per group; E-motif versus vehicle P = 0.0001). *P < 0.05, **P < 0.01, ***P < 0.001, ****P < 0.0001. Scale bar, 50 μm for m, n and o. Statistical tests: log-rank test and Gehan–Breslow–Wilcoxon test (b); two-way ANOVA (c); unpaired two-tailed Student’s t test (equal variance) or unpaired two-tailed t test with Welch’s correction (unequal variance) with a 95% confidence interval (di, ko). Data are presented as mean values ± s.d. (di, ko). Source data
Fig. 3
Fig. 3. E-motif promotes aging partly through adaptive immune activation.
a, Schematic representation of CyTOF analysis performed after 24 weeks of continuous E-motif treatment. b, Left, different cell clusters based on t-SNE dimensionality reduction, with arrows indicating clusters with obviously changed proportions; right, quantification of cell proportions, with red boxes indicating obviously changed clusters (n = 5 per group). NK, natural killer; DC, dendritic cell. c, SPADE analysis and scatter plot illustrating the proportions of cell clusters (n = 5 per group). d, Flow cytometry validation of the T/B cell proportions (T cells: n = 8, B cells: n = 7; T cells: E-motif versus vehicle P = 0.0056, B cells: E-motif versus vehicle P = 0.0022). e, Illustrative representation of the tail vein injection of E-motif in Rag or Rag + T/B mice for healthspan and lifespan examinations. f, Survival curves of Rag and Rag + T/B mice treated with or without E-motif (Rag + vehicle: n = 8, Rag + E-motif: n = 8, Rag + T/B + vehicle: n = 6, Rag + T/B + E-motif: n = 7; Rag + T/B + E-motif versus Rag + T/B + vehicle: P = 0.0021 by log-rank test and P = 0.0032 by Gehan–Breslow–Wilcoxon test, Rag + E-motif versus Rag + vehicle: P = 0.2437 by log-rank test and P = 0.2671 by Gehan–Breslow–Wilcoxon test). g, Body weight changes in mice over time (n = 6 per group over time; Rag + T/B + E-motif versus Rag + T/B + vehicle: at 20 weeks P = 0.0074, at 24 weeks P = 0.0016, at 28 weeks and after P < 0.0001). h, Proportion of fat tissue relative to body weight in mice at the experimental endpoint (age 32 weeks) (n = 7 per group; Rag + T/B + E-motif versus Rag + T/B + vehicle P = 0.0008, Rag + E-motif versus Rag + vehicle P = 0.2992). i, Schematic representation of serum extraction from the peripheral blood of mice. j,k, Serum concentrations of markers of liver function (AST and ALT) (j) and inflammatory factors (IL-1, TNF and MCP-1) (k) (n = 6 per group; ALT: Rag + T/B + E-motif versus Rag + T/B + vehicle P = 0.0044, Rag + E-motif versus Rag + vehicle P = 0.3191; AST: Rag + T/B + E-motif versus Rag + T/B + vehicle P = 0.0007, Rag + E-motif versus Rag + vehicle P = 0.3888; IL-1: Rag + T/B + E-motif versus Rag + T/B + vehicle P = 0.0008, Rag + E-motif versus Rag + vehicle P = 0.4325; TNF: Rag + T/B + E-motif versus Rag + T/B + vehicle P = 0.0034, Rag + E-motif versus Rag + vehicle P = 0.3478; MCP-1: Rag + T/B + E-motif versus Rag + T/B + vehicle P = 0.0011, Rag + E-motif versus Rag + vehicle P = 0.5740). l, Violin plots demonstrating elevated expression of inflammaging-related genes (Cd8a, Trp53, Ifng and Gzmk) in the E-motif group (n = 6 per group). m, UMAP plot showing the clustering and distribution of all T cell subsets after vehicle or E-motif treatment for 24 weeks (left), with pie charts displaying the proportions of T cell subsets in the vehicle and E-motif groups (right) (n = 6 per group). TFH, T follicular helper. n, Bar plot of the relative abundance of T cell subsets between the vehicle and E-motif groups (n = 6 per group). NS, no significance; **P < 0.01, ***P < 0.001, ****P < 0.0001. Statistical tests: log-rank test and Gehan–Breslow–Wilcoxon test (f); two-way ANOVA (g); unpaired two-tailed Student’s t test (equal variance) or unpaired two-tailed t test with Welch’s correction (unequal variance) with a 95% confidence interval (d, h, jk). Data are presented as mean values ± s.d. (d, gh, jk). Illustrations in panels a and e were created using FigDraw. Source data
Fig. 4
Fig. 4. Monocytes/macrophages partly mediate the activation of adaptive immunity by E-motif in a NEU1-dependent manner.
a, t-SNE plot showing cell clusters (left) and quantification of the cell clusters (right), with arrows (left) and the red box (right) highlighting clusters that apparently differ in proportion between the two groups (n = 5 per group). DNT, double-negative T cell. b, Scatter plot of SPADE analysis illustrating the proportions of cell clusters (n = 5 per group). c, Flow cytometry analysis of the proportions of monocytes (left) and neutrophils (right) (monocytes: n = 7 per group, neutrophils: n = 8 per group; monocytes: E-motif versus vehicle P = 0.0007, neutrophils: E-motif versus vehicle P = 0.0067). d, Diagram of cell transplantation using E-motif-injected mice as donors. At 24 h after the injection, different myeloid cells were sorted from donors and transplanted into recipient mice. After five transplantations, recipient mice were killed. e, Proportions of T/B cells in the peripheral blood of recipient mice after cell transplantation (n = 6 per group; T cells: E-mono versus vehicle P = 0.0089, B cells: E-mono versus vehicle P = 0.0044). Mono, monocytes; Neutro, neutrophils; E-mono, monocytes from E-motif-treated mice; E-neutro, neutrophils from E-motif-treated mice. f, Genotype diagram for LysM/iDTR mice (left) and schematic diagram of chimeric mouse construction (right). g, Flow cytometry analysis of the proportions of T/B cells in LysM/iDTR mice (n = 6 per group; T cells: E-motif versus vehicle P = 0.0062, E-motif versus DT + E-motif P = 0.0050; B cells: E-motif versus vehicle P = 0.0021, E-motif versus DT + E-motif P = 0.0047). h,i, Neu1 expression in transcriptomic sequencing data (h; n = 3 per group; E-motif versus vehicle P = 0.0104) and western blot analysis (i; n = 4 per group). TPM, transcripts per million. j, Genotype diagram of mice for the conditional knockout of the Neu1 gene in myeloid cells and the process of E-motif treatment. k, Body weight changes in mice over time (n = 6 per group over time; Neu1f/f + E-motif versus Neu1f/f P = 0.0159, Neu1f/f + E-motif versus Neu1−/− + E-motif P = 0.0061). l,m, Serum levels of the inflammatory markers IL-1 and MCP-1 (l) (n = 6 per group; IL-1: Neu1f/f + E-motif versus Neu1f/f P = 0.0007, Neu1f/f + E-motif versus Neu1−/− + E-motif P = 0.0242; MCP-1: Neu1f/f + E-motif versus Neu1f/f P = 0.0011, Neu1f/f + E-motif versus Neu1−/− + E-motif P = 0.0095) and the liver function markers ALT and AST (m) (n = 6 per group; ALT: Neu1f/f + E-motif versus Neu1f/f P = 0.0065, Neu1f/f + E-motif versus Neu1−/− + E-motif P = 0.0385; AST: Neu1f/f + E-motif versus Neu1f/f P = 0.0081, Neu1f/f + E-motif versus Neu1−/− + E-motif P = 0.0397). n, Representative images of H&E staining of WAT (left top) and liver tissue (left bottom) with quantification of TG content and adipocyte areas (right) (n = 6 per group; TG content: Neu1f/f + E-motif versus Neu1f/f P = 0.0006, Neu1f/f + E-motif versus Neu1−/− + E-motif P = 0.0023; adipocyte area: Neu1f/f + E-motif versus Neu1f/f P = 0.0011, Neu1f/f + E-motif versus Neu1−/− + E-motif P = 0.0085). o, Flow cytometry analysis of the proportions of T/B cells in the peripheral blood (n = 6 per group; T cells: Neu1f/f + E-motif versus Neu1f/f P = 0.0040, Neu1f/f + E-motif versus Neu1−/− + E-motif P = 0.0096; B cells: Neu1f/f + E-motif versus Neu1f/f P = 0.0025, Neu1f/f + E-motif versus Neu1−/− + E-motif P = 0.0056). *P < 0.05, **P < 0.01, ***P < 0.001. Scale bar, 50 μm for n. Statistical tests: unpaired two-tailed Student’s t test (equal variance) or unpaired two-tailed t test with Welch’s correction (unequal variance) with a 95% confidence interval (c, e, gh, lo); two-way ANOVA (k). Data are presented as mean values ± s.d. (c, e, gh, ko). Illustrations in panels f and j were created using FigDraw. Source data
Fig. 5
Fig. 5. DANA, as a NEU1 inhibitor, extends healthspan and lifespan.
a, Schematic diagram illustrating the experimental design of intraperitoneally (i.p.) injecting DANA into mice to study its effects on healthspan and lifespan. b, Survival curves of male mice (vehicle: n = 25, DANA: n = 24; DANA versus vehicle: P < 0.0001 by log-rank test and P < 0.0001 by Gehan–Breslow–Wilcoxon test). c, Time-series analysis of body weight (n = 11 per group over time, but n = 10 for the vehicle group at 80 and 84 weeks; DANA versus vehicle: at 80 weeks P = 0.0133, at 84 weeks P = 0.0087). d, Analysis of the percentages of fat tissue (left) and lean tissue (right) relative to body weight at the experimental endpoint (84 weeks of age) (n = 10 per group; fat tissue: DANA versus vehicle P = 0.0010, lean tissue: DANA versus vehicle P = 0.0378). e, Representative X-ray images of mice, with black lines indicating the basis for kyphosis index calculation (left), and quantification of the kyphosis index (right) (n = 6 per group; DANA versus vehicle P = 0.0274). f, P16 gene expression pattern in P16-3MR mice (top), along with in vivo bioluminescence imaging (bottom left) and quantification (bottom right) (n = 4 per group; DANA versus vehicle P = 0.0445). g, Movement trajectories of mice in the open field test. h, Total movement distance (left) and average speed (right) (n = 6 per group; total movement distance: DANA versus vehicle P = 0.0025, average speed: DANA versus vehicle P = 0.0026). i, Treadmill test schematic (left) and analysis of the number of electric shocks administered (right) (n = 9 per group; DANA versus vehicle P = 0.0084). j, Schematic representation of serum extraction from peripheral blood samples. k, Serum levels of AST and ALT (n = 7 per group; AST: DANA versus vehicle P = 0.0044, ALT: DANA versus vehicle P = 0.0347). l, Heatmap depicting the levels of serum inflammatory markers, with fold changes relative to the mean values of the vehicle group (n = 5 per group). m, Representative images of H&E staining of WAT (left) and quantification of the adipocyte area (right) (vehicle: n = 6, DANA: n = 7; DANA versus vehicle P = 0.0005). n, Representative images of H&E staining of skin tissue (left) and quantification of epidermal thickness (right) (n = 7 per group; DANA versus vehicle P < 0.0001). o, Representative images of H&E staining of liver tissue (left) and quantification of TG content (right) (n = 7 per group; DANA versus vehicle P < 0.0001). p, Schematic diagram illustrating the experimental design of the study investigating the synergistic effects of DANA with rapamycin (R). q, Survival curves of mice injected with vehicle, DANA, R and DANA + R (vehicle: n = 12; DANA, R, DANA + R: n = 13; DANA + R versus vehicle: P < 0.0001 by log-rank test and P = 0.0003 by Gehan–Breslow–Wilcoxon test, DANA + R versus DANA: P = 0.0205 by log-rank test and P = 0.0225 by Gehan–Breslow–Wilcoxon test, DANA + R versus R: P = 0.0406 by log-rank test and P = 0.0546 by Gehan–Breslow–Wilcoxon test). r, Body weight changes in mice over time (n = 6 per group; DANA + R versus vehicle: at 76 weeks P = 0.0015, at 80 weeks P = 0.0008, at 84 weeks P < 0.0001). s, Serum levels of the inflammatory markers IL-1 and MCP-1 (n = 6 per group; IL-1: DANA + R versus vehicle P = 0.0002, DANA + R versus R P = 0.0062, DANA + R versus DANA P = 0.0386; MCP-1: DANA + R versus vehicle P = 0.0007, DANA + R versus R P = 0.0073, DANA + R versus DANA P = 0.0035). t, Representative images of H&E staining of liver tissue (left) with quantification of TG content (right) (n = 6 per group; DANA + R versus vehicle P = 0.0005, DANA + R versus R P = 0.0022, DANA + R versus DANA P = 0.2455). u, Representative images of H&E staining of WAT (left) with quantification of the adipocyte area (right) (n = 6 per group; DANA + R versus vehicle P = 0.0003, DANA + R versus R P = 0.0485, DANA + R versus DANA P = 0.0055). *P < 0.05, **P < 0.01, ***P < 0.001, ****P < 0.0001. Scale bar, 50 μm for m, n, o, t and u. Statistical tests: log-rank test and Gehan–Breslow–Wilcoxon test (b); two-way ANOVA (c, r); unpaired two-tailed Student’s t test (equal variance) or unpaired two-tailed t test with Welch’s correction (unequal variance) with a 95% confidence interval (df, hk, mo); one-way ANOVA with Bonferroni post hoc test (su). The dashed line in bar plots represents the average values for middle-aged mice (36 weeks old). Data are presented as mean values ± s.d. (cf, hk, mo, ru). Illustrations in panels a and p were created using FigDraw. Source data
Fig. 6
Fig. 6. Potential clinical values of ELN fragments and DANA.
a, Schematic diagram illustrating the experimental design of the study investigating the effects of DANA on E-motif-induced aging in Yorkshire pigs. b, Serum levels of AST, ALP, ALB, TG, LDL, BUN, CREA and GLU in the pig model (n = 4 per group; AST: E-motif versus vehicle P = 0.0053, E-motif + DANA versus E-motif P = 0.0113; ALP: E-motif versus vehicle P = 0.0169, E-motif + DANA versus E-motif P = 0.0078; ALB: E-motif versus vehicle P = 0.0071, E-motif + DANA versus E-motif P = 0.0279; TG: E-motif versus vehicle P < 0.0001, E-motif + DANA versus E-motif P = 0.0188; LDL: E-motif versus vehicle P = 0.0035, E-motif + DANA versus E-motif P = 0.0078; BUN: E-motif versus vehicle P = 0.0086; CREA: E-motif versus vehicle P = 0.0195, E-motif + DANA versus E-motif P = 0.0167; GLU: E-motif versus vehicle P = 0.0277, E-motif + DANA versus E-motif P = 0.0385). c, Illustration of the construction of an immune-humanized mouse model and experimental design of the study investigating the effects of DANA on E-motif-induced aging in immune-humanized mice. HSCs, hematopoietic stem cells. d, Serum levels of AST, ALP, ALB, TG, LDL, BUN, CREA and GLU in the immune-humanized mouse model (hmice) (n = 4 per group; AST: ELN versus vehicle P = 0.0067, ELN + DANA versus ELN P = 0.0073; ALP: ELN versus vehicle P = 0.0091, ELN + DANA versus ELN P = 0.0162; ALB: ELN versus vehicle P = 0.0161, ELN + DANA versus ELN P = 0.0057; TG: ELN versus vehicle P = 0.0143, ELN + DANA versus ELN P = 0.0156; LDL: ELN versus vehicle P = 0.0056, ELN + DANA versus ELN P = 0.0104; CREA: ELN versus vehicle P = 0.0101, ELN + DANA versus ELN P = 0.0295; GLU: ELN + DANA versus ELN P = 0.0454). e, Relationship between the serum content of ELN fragments and age in a human cohort. The red dashed line represents the linear regression line (n = 1,068; P < 0.0001). f, Heatmap showing the correlation between the serum levels of ELN fragments and various aging markers or negative health indicators across different age groups in the human population, based on β coefficients from a regression analysis. hs-CRP, high-sensitivity C-reactive protein; GGT, gamma-glutamyl transferase; TP, total protein; DBiL, direct bilirubin; IBiL, indirect bilirubin; TBiL, total bilirubin; FBG, fasting blood glucose; e-GFR, estimated glomerular filtration rate; URIC, uric acid; HDL, high-density lipoprotein; TCH, total cholesterol; T3, triiodothyronine; hs-TSH, high-sensitivity thyroid-stimulating hormone; T4, thyroxine. Red blocks represent a positive correlation (total, n = 1,068; age 20–30 years, n = 197; 31–40 years, n = 233; 41–50 years, n = 187; 51–60 years, n = 187; 61–70 years, n = 201; >70 years, n = 63). g, Statistical analysis of SBP and DBP in the high ELN and normal ELN groups (normal group: n = 375, high group: n = 186; SBP: normal versus high P < 0.0001, DBP: normal versus high P < 0.0001). h, Statistical analysis of BMI and the serum levels of AST, ALP, ALB, TG, LDL, urea, CREA and GLU in the high ELN and normal ELN groups (BMI: normal group n = 370, high group n = 183, normal versus high P < 0.0001; AST: normal group n = 401, high group n = 187, normal versus high P = 0.0061; ALP: normal group n = 401, high group n = 187, normal versus high P < 0.0001; ALB: normal group n = 401, high group n = 187, normal versus high P < 0.0001; TG: normal group n = 367, high group n = 176, normal versus high P < 0.0001; LDL: normal group n = 367, high group n = 176, normal versus high P = 0.0004; urea: normal group n = 400, high group n = 187, normal versus high P < 0.0001; CREA: normal group n = 400, high group n = 187, normal versus high P < 0.0001; GLU: normal group n = 401, high group n = 187, normal versus high P < 0.0001). In the box plots, the center line denotes the median, the box range indicates the 25th–75th percentile range, and whiskers denote minimum–maximum values (g, h). *P < 0.05, **P < 0.01, ***P < 0.001, ****P < 0.0001. Statistical tests: Pearson correlation coefficients with a two-tailed 95% confidence interval (e, f); unpaired two-tailed Student’s t test (equal variance) or unpaired two-tailed t test with Welch’s correction (unequal variance) with a 95% confidence interval (b, d, g, h). Data are presented as mean values ± s.d. (b, d, g, h). Source data
Extended Data Fig. 1
Extended Data Fig. 1. Endogenous ELN fragments induce systemic aging in a positive feedback loop.
a, Diagram illustrating the ELN fragments collected from old (ECO) or young (ECY) mice being injected into receptor young mice. b, Body weight changes of mice treated with ECO/ECY or vehicle over time (n = 6 per group, ECO versus vehicle at 24 weeks P = 0.0003, at 28 weeks P < 0.0001). c, The proportion of fat tissue (left) or lean tissue (right) to the total body weight in mice at the experimental endpoint (n = 6 per group, Fat tissue: ECO versus vehicle P = 0.0016, ECO versus ECY P = 0.0044; Lean tissue: ECO versus vehicle P = 0.0066, ECO versus ECY P = 0.0443). d,e, Serum levels of ALT and AST (n = 6 per group, ALT: ECO versus vehicle P = 0.0091; AST tissue: ECO versus vehicle P = 0.0014, ECO versus ECY P = 0.0194). f, Open field test, including movement trajectories (left) and average speed (right) (n = 6 per group, ECO versus vehicle P = 0.0020, ECO versus ECY P = 0.0151). g, Serum levels of MCP-1 and IL-1 (n = 6 per group, MCP-1: ECO versus vehicle P = 0.0022; IL-1: ECO versus vehicle P = 0.0147). h, Representative H&E-stained images of liver and white adipose tissue (WAT), with corresponding quantification of hepatic triglyceride content and adipocyte area. (n = 6 per group, Liver triglyceride: ECO versus vehicle P = 0.0018, ECO versus ECY P = 0.0243; Adipocyte area: ECO versus vehicle P = 0.0007, ECO versus ECY P = 0.0030). Scale bar = 50 μm. i, The proportion of lymphocyte in WBC after direct injection of ECO/ECY (left) or injection with monocytes/macrophages sorted from ECO/ECY-treated mice (n = 6 per group, Lymphocytes: ECO versus vehicle P = 0.0025, ECO versus ECY P = 0.0166; Lymphocytes: ECO-mono versus Mono P = 0.0045, ECO-mono versus ECY-mono P = 0.0312). j, Diagram illustrating ECO treatment in combination with IgG or anti-elastin antibody. k, Body weight changes of mice treated with ECO+IgG or ECO+antibody over time (n = 6 per group, ECO+antibody versus ECO+IgG P = 0.0137 at 28 weeks). l, The proportion of fat tissue (left) or lean tissue (right) to the total body weight in mice at the experimental endpoint (n = 6 per group, Fat tissue: ECO+anti versus ECO+IgG P = 0.0094; Lean tissue: ECO+anti versus ECO+IgG P = 0.0224). m, Serum levels of AST and ALT (n = 6 per group, AST: ECO+anti versus ECO+IgG P = 0.0081; ALT: ECO+anti versus ECO+IgG P = 0.0319). n, Serum levels of MCP-1 and IL-1 (n = 6 per group, MCP-1: ECO+anti versus ECO+IgG P = 0.0060; IL-1: ECO+anti versus ECO+IgG P = 0.0012). o, Open field test, including movement trajectories and average speed (n = 6 per group, ECO+anti versus ECO+IgG P = 0.0024). p, Diagram illustrating senolytic cocktail treatment regimen and subsequent examination. q, Serum levels of ELN fragments (Young group: n = 6, Old and Old D + Q groups: n = 7; Old versus Young P < 0.0001, Old D + Q versus Old P = 0.0048). r, qPCR analysis of P16INK4A in neutrophils (left) and macrophages (right) (Young group: n = 6, Old and Old+Q groups: n = 7; P16 in neutrophil: Old versus Young P = 0.0002, Old D + Q versus Old P = 0.0038; P16 in macrophage: Old versus Young P < 0.0001, Old D + Q versus Old P = 0.0008). s, Levels of neutrophil elastase (NE) (left) and macrophage elastase (ME) (right) in the supernatant of cultured neutrophils and macrophages, respectively (Young group: n = 6, Old and Old+Q groups: n = 7; NE content: Old versus Young P = 0.0003, Old D + Q versus Old P = 0.0039; ME content: Old versus Young P < 0.0001, Old D + Q versus Old P = 0.0010). t, Diagram illustrating NE inhibitor or ME inhibitor treatment regimen and subsequent examination (left). Serum levels of ELN fragments (right) (Young group: n = 6, Old and Old+Q groups: n = 7; Old versus Old+MEi P = 0.0117, Old+MEi versus Old+NEi P = 0.0019). * P < 0.05, ** P < 0.01, *** P < 0.001, **** P < 0.0001, #P < 0.05. Scale bar = 50 μm for h. Two-way ANOVA (b,k). Unpaired two-tailed Student’s t-test (equal variance) or unpaired two-tailed with Welch’s correction (unequal variance) with a 95% confidence interval (c-i,l-o,q-t). Data are presented as mean values ± SD. Illustrations in panels a, j, p, t were created using FigDraw. Source data
Extended Data Fig. 2
Extended Data Fig. 2. E-motif induces systemic aging.
a, The weight of abdominal fat of mice at the experimental endpoint aged 36 weeks) (n = 10 per group, E-motif versus vehicle P = 0.0002). b, Hang wire test and corresponding quantification of hanging time (n = 7 per group, E-motif versus vehicle P = 0.0029). Illustration was created using FigDraw. c, Serum biochemistry analysis (TG, LDL, and GLU levels) in mice (n = 6 per group, TG: E-motif versus vehicle P = 0.0086; LDL: E-motif versus vehicle P = 0.0049; GLU: E-motif versus vehicle P = 0.0024). d,e, Levels of serum inflammatory markers (IFN-γ and IL-6) in mice (n = 8 per group, IFN-γ: E-motif versus vehicle P = 0.0053; IL-6: E-motif versus vehicle P = 0.0415). f, Representative H&E-stained images of muscle fibers (left) and quantification of cross-sectional areas (right) (n = 10 per group, scale bar = 50 μm, E-motif versus vehicle P = 0.0021). g, Representative micro-CT images of bone tissue and the quantification of bone volume/tissue volume (BV/TV) and trabecular thickness (Tb.Th) (n = 10 per group, scale bar = 1 mm, BV/TV: E-motif versus vehicle P = 0.0183; Tb.Th: E-motif versus vehicle P = 0.0059). h, Body weight changes of mice treatment with scramble peptide or vehicle over time (n = 6 per group). i,j, The proportion of fat tissue (i) or lean tissue (j) to the total body weight in mice at the experimental endpoint (n = 6 per group). k, Serum levels of ALT and AST (n = 6 per group). l, Open field test, including movement trajectories and average speed (n = 6 per group). m, Representative H&E-stained images of liver tissue and WAT and the quantification of triglyceride content and adipocyte areas (n = 6 per group). All the comparison between Scramble and vehicle group did not show statistical significance. * P < 0.05, ** P < 0.01, *** P < 0.001, **** P < 0.0001. Scale bar = 1 mm for g and scale bar = 50 μm for f,m. Two-way ANOVA (h). Unpaired two-tailed Student’s t-test (equal variance) or unpaired two-tailed with Welch’s correction (unequal variance) with a 95% confidence interval (a-g,i-m). Data are presented as mean values ± SD. Source data
Extended Data Fig. 3
Extended Data Fig. 3. Multi-omic analysis of E-motif treated mice.
a,b, Schematic representation of RNAseq of multi-tissue including heart, liver, muscle, lung, kidney, WAT, PBMCs and brain (a) and quantification of differential expressed genes (DEGs) (b) (n = 3 per group). Red bar showed the number of upregulated DEGs in E-motif group. Illustration in panel a was created using FigDraw. c, Volcano plots displaying DEGs across heart, liver, muscle, lung, kidney, WAT and brain tissues (n = 3 per group). d, Volcano plot displaying DEGs in PBMCs between the E-motif and the vehicle group (n = 3 per group). e, Top10 terms upregulated in the E-motif group based on GO enrichment analysis of PBMCs transcriptomic data (n = 3 per group). f, GSEA analysis identifying pathways upregulated in the E-motif group in PBMCs (n = 3 per group). g, GSEA analysis across multiple solid organs with normalized enrichment score (NES) values represented in a heatmap. Red block means upregulation in the E-motif group (n = 3 per group). h, GSEA analysis identifying pathways upregulated in the E-motif group in PBMCs (n = 3 per group). i, T-SNE dimensionality reduction plot (left) and histogram plot (right) showing relative expression of protein markers (n = 5 per group). j, SPADE tree derived from CyTOF data illustrating relationships between cell clusters and relative expression of protein markers (n = 5 per group). Source data
Extended Data Fig. 4
Extended Data Fig. 4. Lymphocyte activation mediated E-motif induced systemic aging.
a, Flow cytometry analysis of Rag mice (left) and Rag mice adoptively transferred with T/B cells (right). b, The proportion of lean tissue to total body weight (left) and the weight of abdominal fat in mice at the experimental endpoint (n = 7 per group, Lean tissue: Rag+T/B + E-motif versus Rag+T/B+vehicle P = 0.0010; Abdominal fat: Rag+T/B + E-motif versus Rag+T/B+vehicle P = 0.0003). c, Serum levels of IL-6 and IFN-γ (n = 6 per group, IL-6: Rag+T/B + E-motif versus Rag+T/B+vehicle P = 0.0047; IFN-γ: Rag+T/B + E-motif versus Rag+T/B+vehicle P = 0.0095). d, Representative H&E-stained images of liver tissue (left) and the quantification of triglyceride content (right) (n = 6 per group). e, Representative H&E-stained images of WAT (left) and the quantification of adipocyte areas (right) (n = 6 per group). f, Representative H&E-stained images of skin tissue (left) and the quantification of epidermal thickness (right). g, Representative H&E-stained images of muscle fibers (left) and the quantification of cross-sectional areas (right) (n = 6 per group). h, Representative micro-CT images of bone tissue and the quantification of BV/TV and Tb.Th (n = 6 per group). ** P < 0.01, *** P < 0.001. Scale bar = 1 mm for h, scale bar = 50 μm for d-g. Unpaired two-tailed Student’s t-test with a 95% confidence interval (b-h). Source data
Extended Data Fig. 5
Extended Data Fig. 5. Single-cell transcriptomic analysis of splenic lymphocyte after long-term E-motif treatment.
a,b, Plot of spleen (a) and the quantification of spleen weight (b) (n = 8 per group, Spleen weight: E-motif versus vehicle P = 0.0032). c, UMAP plots of all the cells colored by cell type (T cells vs. B cells, left) and by treatment group (E-motif vs. vehicle, right). d, Volcano plots showing differentially expressed genes (DEGs) between vehicle and E-motif groups for T cells and B cells, respectively. e, UMAP feature plots showing increased expression of aging-associated genes (Cd8a, P53, Ifn-γ and Gzmk) in E-motif-treated cells. f, Top20 terms of GO enrichment analysis (Biological Process) of DEGs upregulated in E-motif group. g, Cluster-specific gene expression profiles of T cell subtypes, highlighting distinct transcriptional signatures across subsets. h, GO enrichment analysis (Biological Process) of individual T cell subclusters upregulated by E-motif treatment. **P < 0.01. In each group of single-cell RNAseq, 6 mice were pooled together for detection. Unpaired two-tailed Student’s t-test with a 95% confidence interval (b). Source data
Extended Data Fig. 6
Extended Data Fig. 6. Cytof analysis of PBMCs after 24-hour E-motif treatment.
a, T-SNE dimensionality reduction plot and histogram plot illustrating relative expression of protein markers (n = 5 per group). b, SPADE tree derived from CyTOF data, illustrating relationships between cell clusters and relative expression of protein markers (n = 5 per group).
Extended Data Fig. 7
Extended Data Fig. 7. E-motif induces inflammation in myeloid cells through NEU1.
a, Schematic representation of spleen and blood extraction and monocytes/macrophages sorting after E-motif injection. b, Volcano plot illustrating differential gene expression between the E-motif and vehicle groups (n = 3 per group). c, GO enrichment analysis depicting the top12 upregulated terms in monocytes/macrophages in the E-motif group (n = 3 per group). d - g GSEA analysis of genes upregulated by E-motif in the “GO Biological Process” and “KEGG pathway” dataset (n = 3 per group). h, Quantitative analysis of western blot in Fig. 4i (n = 4 per group, E-motif versus vehicle P = 0.0202). i, qPCR analysis of Neu1, Tlr-2 and Tlr-4 gene expression to verify the knockdown efficiency of siRNA (n = 4 per group, P < 0.0001 for all groups). The red dashed line indicates relative gene expression in the vehicle group. j, IL-1 and IL-6 levels in cultural supernatant of bone marrow-derived macrophages from wild-type mice (n = 4 per group, IL-1: E-motif versus vehicle P = 0.0007, E-motif versus E-motif+siTLR2/4 P = 0.0092, E-motif versus E-motif+siNEU1 P = 0.0039; IL-6: E-motif versus vehicle P = 0.0040, E-motif versus E-motif+siTLR2/4 P = 0.0342, E-motif versus E-motif+siNEU1 P = 0.0031). k, Western blot analysis of NEU1 protein level in Neu1f/f (without tamoxifen treatment) and Neu1/ mice. l, Illustrative representation of the process of obtaining macrophages from the bone marrow of Neu1/ mice. m, IL-1 and IL-6 levels in cultural supernatant of bone marrow-derived macrophages from Neu1/ mice after E-motif treatment. n, IL-1 and IL-6 levels in cultural supernatant of bone marrow-derived macrophages from wild-type mice after E-motif or E-motif+DANA treatment (n = 4 per group, IL-1: E-motif versus vehicle P = 0.0039, E-motif+DANA versus E-motif P = 0.0305; IL-6: E-motif versus vehicle P = 0.0019, E-motif+DANA versus E-motif P = 0.0093). * P < 0.05, ** P < 0.01, *** P < 0.001. Unpaired two-tailed Student’s t-test (equal variance) or unpaired two-tailed with Welch’s correction (unequal variance) with a 95% confidence interval (h-j,m,n). Illustrations in panels a and l were created using FigDraw. Source data
Extended Data Fig. 8
Extended Data Fig. 8. DANA counteract E-motif-induced systemic aging.
a, Diagram illustrating cell transplantation using mice injected with E-motif or E-motif+DANA as donors. b, Survival curves for Rag mice after adoptively transferred with T/B cells from Neu1/ mice treated with or without E-motif (Rag+Neu1/vehicle-T/B: n = 9, Rag+Neu1/E-motif-T/B: n = 10, no significant difference between Rag+Neu1/E-motif-T/B and Rag+Neu1/vehicle-T/B). c, Illustrative representation of three groups of different treatment (vehicle, E-motif, and E-motif combined with DANA) over a 16-week period to verify the roles of DANA. Illustration was created using FigDraw. d, Body weight changes of mice treatment with E-motif, E-motif+DANA or vehicle over time (n = 6 per group; E-motif versus vehicle P = 0.0079, E-motif+DANA versus E-motif P = 0.0297). e, The ratio of T/B cells in peripheral blood (n = 6 per group, B cells: E-motif versus vehicle P = 0.0218, E-motif+DANA versus E-motif P = 0.0097; T cells: E-motif versus vehicle P = 0.0069, E-motif+DANA versus E-motif P = 0.0173). f,g, Serum levels of ALT, AST, IL-1 and MCP-1 (n = 6 per group, ALT: E-motif versus vehicle P = 0.0028, E-motif+DANA versus E-motif P = 0.0092; AST: E-motif versus vehicle P = 0.0040, E-motif+DANA versus E-motif P = 0.0170; IL-1: E-motif versus vehicle P = 0.0005, E-motif+DANA versus E-motif P = 0.0013; MCP-1: E-motif versus vehicle P = 0.0022, E-motif+DANA versus E-motif P = 0.0072). h, Survival curves for mice after cell transplantation using mice injected with E-motif or E-motif+DANA as donors (Rag-T/B and Rag+E-motif-DANA-T/B: n = 9 per group, Rag+E-motif-T/B: n = 8; Rag+E-motif-T/B versus Rag-T/B P = 0.0061 by log-rank test and P = 0.0025 by Gehan–Breslow–Wilcoxon test, Rag+E-motif-T/B versus Rag+E-motif-DANA-T/B P = 0.0279 by log-rank test and P = 0.0172 by Gehan–Breslow–Wilcoxon test). i, Serum levels of ELN fragments (n = 6, E-motif+DANA versus E-motif P = 0.0364). * P < 0.05, ** P < 0.01, *** P < 0.001. Unpaired two-tailed Student’s t-test with a two-tailed 95% confidence interval (e-g). Log-rank test and Gehan–Breslow–Wilcoxon test (b,h). Two-way ANOVA (d,i). Source data
Extended Data Fig. 9
Extended Data Fig. 9. DANA monotherapy or combined with Rapamycin alleviates aging in naturally-aged mice.
a, Illustrative representation of DANA treatment regimen. Illustration was created using FigDraw. b, Survival curves for mice treated with DANA or vehicle (vehicle: n = 25, DANA: n = 24; DANA versus vehicle P < 0.0001 by log-rank test and P = 0.0003 by Gehan–Breslow–Wilcoxon test). c, Abdominal fat weight of mice (vehicle: n = 7, DANA: n = 8, DANA versus vehicle P = 0.0012) at the experimental endpoint (84 weeks of age). d, Statistical hanging time of hang wire test (n = 6 per group, DANA versus vehicle P = 0.0015). e,f, Levels of serum biochemistry markers (TG, LDL, and GLU) in mice (n = 7 per group, GLU: DANA versus vehicle P = 0.0376; LDL: DANA versus vehicle P = 0.0061; TG: DANA versus vehicle P = 0.0034). g, Representative H&E-stained images of muscle fiber (left) and the quantification of cross-sectional areas (right) (n = 7 per group, scale bar = 50 μm, DANA versus vehicle P = 0.0134). h, Representative micro-CT images of bone tissue and the quantification of BV/TV and Tb.Th (n = 7 per group, scale bar = 1 mm). i, Serum levels of ELN fragments (n = 8 per group, DANA versus vehicle P = 0.0035). *p < 0.05, **p < 0.01. The black dashed line in bar plots indicates the average value for middle-aged mice (36 weeks of age). j,k, The proportion of lean tissue (j) or fat tissue (k) to the total body weight in mice at the experimental endpoint, 84 weeks (n = 6 per group, Lean tissue: DANA + R versus vehicle P = 0.0040, DANA + R versus DANA P = 0.0263, DANA + R versus R P = 0.0395; Fat tissue: DANA + R versus vehicle P = 0.0005, DANA + R versus DANA P = 0.0069). l, Serum levels of AST (left) and ALT (right) (n = 6 per group, AST: DANA + R versus vehicle P = 0.0009, DANA + R versus DANA P = 0.0456, DANA + R versus R P = 0.0014; ALT: DANA + R versus vehicle P = 0.0002, DANA + R versus DANA P = 0.0059, DANA + R versus R P = 0.0163). m, Open field test, including movement trajectories (left) and average speed (right) (n = 6 per group, DANA + R versus vehicle P = 0.0007, DANA + R versus R P = 0.0379). n, Representative H&E-stained images of muscle fibers (left) and quantification of cross-sectional areas (right) (n = 6 per group, DANA + R versus vehicle P < 0.0001, DANA + R versus DANA P = 0.0035, DANA + R versus R P = 0.0319). * P < 0.05, ** P < 0.01, *** P < 0.001, **** P < 0.0001. Scale bar = 1 mm for h, scale bar = 50 μm for g,n. Unpaired two-tailed Student’s t-test with a two-tailed 95% confidence interval (c-h). Log-rank test and Gehan–Breslow–Wilcoxon test (b). Two-way ANOVA (i-n). Source data
Extended Data Fig. 10
Extended Data Fig. 10. DANA alleviates the inflammatory response of human macrophages induced by human serum with high content of ELN fragments.
a, Age statistics of serum samples from high ELN fragments (High) and normal ELN fragments (Normal) population (n = 12 per group). b, Statistics of serological ELN contents in each group (n = 12 per group, High versus Normal p < 0.0001). c,d, Inflammatory cytokines including IL-1 and IL-6 in cultural supernatant of macrophages derived from THP-1 cells among Normal, High+DANA and High group (n = 12 per group, IL-1: High versus Normal P < 0.0001, High+DANA versus High P = 0.0086; IL-6: High versus Normal P < 0.0001, High+DANA versus High P = 0.0109). * P < 0.05, ** P < 0.01, **** P < 0.0001. Unpaired two-tailed Student’s t-test (equal variance) or unpaired two-tailed with Welch’s correction (unequal variance) (a-d). Source data

References

    1. Selman, M. & Pardo, A. Fibroageing: an ageing pathological feature driven by dysregulated extracellular matrix–cell mechanobiology. Ageing Res. Rev.70, 101393 (2021). - PubMed
    1. López-Otin, C., Blasco, M. A., Partridge, L., Serrano, M. & Kroemer, G. Hallmarks of aging: an expanding universe. Cell186, 243–278 (2023). - PubMed
    1. Smith, E. R. et al. Elastin degradation is associated with progressive aortic stiffening and all-cause mortality in predialysis chronic kidney disease. Hypertension59, 973–978 (2012). - PubMed
    1. Petersen, E., Wågberg, F. & Angquist, K.-A. Serum concentrations of elastin-derived peptides in patients with specific manifestations of atherosclerotic disease. Eur. J. Vasc. Endovasc. Surg.24, 440–444 (2002). - PubMed
    1. Skjøt-Arkil, H. et al. Measurement of MMP-9 and -12 degraded elastin (ELM) provides unique information on lung tissue degradation. BMC Pulm. Med.12, 34 (2012). - PMC - PubMed

LinkOut - more resources