. 2025 Oct;21(10):e70749.
doi: 10.1002/alz.70749.

Catecholaminergic nucleus integrity and Alzheimer's pathology, symptoms, and progression

Affiliations

Catecholaminergic nucleus integrity and Alzheimer's pathology, symptoms, and progression

Michael C B David et al. Alzheimers Dement. 2025 Oct.

Abstract

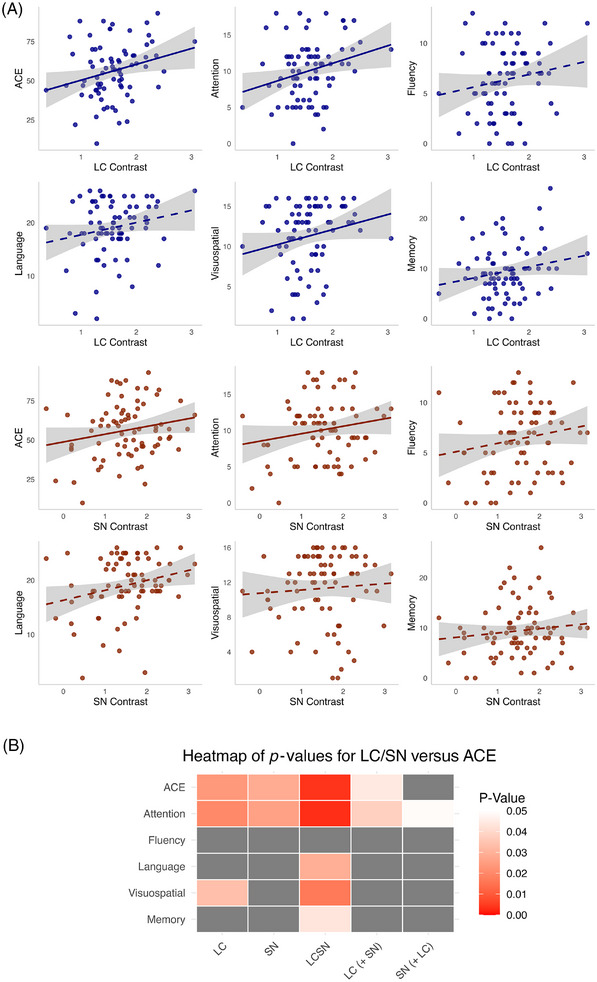
Background: The noradrenergic locus coeruleus (LC) accumulates pathology early in Alzheimer's disease (AD), with LC dysfunction contributing to symptoms and disease progression. We investigated LC and substantia nigra (SN) integrity in healthy controls and AD participants.

Methods: Ninety-three AD participants and 29 controls underwent neuromelanin magnetic resonance imaging. LC and SN contrast, reflecting nucleus integrity, related to cognitive and neuropsychiatric symptoms, as well as cognitive decline and atrophy rates.

Results: LC - but not SN - integrity was reduced in AD versus controls (b = -0.39, p = 0.001) and within AD was associated with global cognition (b = 8.53, p = 0.04) and neuropsychiatric symptoms, accounting for SN. An AD subgroup with reduced SN integrity had worse cognition. LC integrity predicted plasma phosphorylated tau protein 217 (b = -0.30, p = 0.03). Lower LC and SN integrities were both related to faster cognitive decline (LC: b = -4.74, p = 0.048; SN: b = -2.27, p = 0.03), accounting for one another.

Discussion: Catecholaminergic nucleus integrity plays an important role in AD. Both systems are relevant to cognitive performance and decline. LC, in particular, relates closely to symptoms, pathology, and rate of progression.

Highlights: In symptomatic AD, LC integrity reflects cortical AD pathology, measured by pTau217. LC integrity predicts cognitive function in AD, independent of cortical atrophy. LC and SN integrity independently relate to attentional performance. Symptoms of anxiety, depression, and apathy are associated with lower LC integrity. LC and SN relate to cognitive decline rate and left LC predicts atrophy rate.

Keywords: catecholamines; cognition; disease progression; dopamine; locus coeruleus; neuromelanin; neuropsychiatric symptoms; noradrenaline; norepinephrine; substantia nigra.


Conflict of interest statement

Paresh A. Malhotra is lead for a NIHR‐funded trial with drug/placebo provided by Takeda Pharmaceuticals and sits on the Data Monitoring Committee for a trial carried out by Johnson & Johnson. He is vice chair of the Alzheimer's Society Research Strategy Council and NIHR Specialty Lead for Dementia and Neurodegeneration, Research Delivery Network. He is also an independent member of a data monitoring committee. All other authors have nothing to disclose. Author disclosures are available in the Supporting Information.

Figures

FIGURE 1
FIGURE 1
Sources and biosynthesis of catecholamines. Top left: location and projections of LC (blue) and SN (red). Bottom left: anatomy of nuclei on axial slices through brainstem. Right: biosynthetic pathway of dopamine, noradrenaline, and adrenaline. CA, caudate; LC, locus coeruleus; NA, nucleus accumbens; PU, putamen; SN, substantia nigra; TH, thalamus; VTA, ventral tegmental area.
FIGURE 2
FIGURE 2
LC and SN integrity in AD and healthy aging. Violin plots showing LC (A) and SN (B) contrast by group. Data from all visits plotted, including multiple timepoints for 19 AD participants. Significance shown is the result of linear mixed‐effects models adjusting for covariates. **p < 0.01. (C) Scatter plot showing relationship between LC and SN contrast, split by group. (D and E) Scatter plot showing relationship between LC/SN contrast and age, split by group. (F) Scatter plot showing relationship between LC contrast and ACE, split by group. (G and H) Scatter plots showing LC/SN contrast over time, relative to baseline scan, in AD participants only. Values from same participant joined by gray line. There is no significant group level change over time for either measure. For (A–F), the shaded error bar shows standard error of the mean. For (C–F), the line of best fit through the raw data is plotted. AD, Alzheimer's disease (green); HC, healthy control (gold); LC, locus coeruleus; SN, substantia nigra.
FIGURE 3
FIGURE 3
Relationship with ACE total score and subdomain scores. (A) Scatter plots showing relationship with ACE for LC (blue) and SN (brown) contrast in AD, one timepoint per participant. Significant relationships according to linear regression models run separately for each nucleus are shown with a solid line of best fit through the raw data. Shaded error bar shows standard error of the mean. (B) Heatmap showing the p values resulting from linear regression models. All models include age, sex, education, and length of symptoms as covariates. The LC (+ SN) column shows the p value related to the LC in the model in which both contrast values are included in the same model, and vice versa for SN (+ LC). LCSN is a single composite value derived from both nuclei. p > 0.05 marked in gray. ACE, Addenbrooke's Cognitive Examination total score; LC, locus coeruleus; SN, substantia nigra.
FIGURE 4
FIGURE 4
Clustering of AD participants and relationships with cognition (A) density plots showing distribution of LC and SN contrast values (converted to z‐scores relative to controls) in AD group. (B) Scatter plot showing clusters of AD participants based on their LC/SN contrast values. (C) Box plots showing ACE total and subdomain scores for each AD cluster. Significance shown is the result of analysis of covariance adjusting for covariates. Post hoc Tukey adjustment performed for comparisons between clusters within each ACE domain. *p < 0.05, **p < 0.01. ACE, Addenbrooke's Cognitive Examination total score; AD, Alzheimer's disease; LC, locus coeruleus; SN, substantia nigra.
FIGURE 5
FIGURE 5
Using LC contrast to predict neuropsychiatric symptoms. Box plots showing significantly lower LC contrast for participants with versus without NPI score > 0 for (A) apathy, (B) anxiety, and (C) depression. (D–L) No difference seen in contrast between those with and without the other symptoms. Significance shown is the result of logistic regression adjusting for covariates. *p < 0.05, **p < 0.01. LC, locus coeruleus; NPI, Neuropsychiatric Inventory.
FIGURE 6
FIGURE 6
LC and SN integrity and disease progression. (A–C) Violin plots showing plasma pTau217, GFAP, and NfL by group. (D) Scatter plot showing relationship between plasma pTau217 and ACE, split by group. Shows a significant relationship across all participants, accounting for group, with no group interaction. (E and F) Scatter plot showing relationship between plasma pTau217 and LC contrast, split by group, showing significant relationship in AD but not HC. (D–F) Lines of best fit plotted through raw data. (G) Timeline of ADAS‐Cog relative to MRI scan used to compare LC contrast against rate of cognitive decline. The red and blue dots represent first and last ADAS‐Cog for each participant, respectively. Solid black vertical line represents the time of the MRI scan. Dashed black vertical line represents 1 year before/after the MRI scan. All scans fell during, or within 1 year of, the period of longitudinal cognitive testing. (H) Line graph representing each participant's ADAS‐Cog scores over time. Baseline taken as date of first ADAS‐Cog. Line color represents LC contrast value for that participant measured on a single MRI scan, with darker color indicating higher contrast. (I) Scatter plot showing LC contrast against annual rate of change in ADAS‐Cog score, with line of best fit through raw data. Panels (J) and (K) are as in (H) and (I) but for SN. Significant p values (< 0.05) in bold. All models include age, sex, and length of symptoms as covariates, plus education for cognitive decline. Shaded error bars show standard error of the mean. **p < 0.01, ***p < 0.001. ACE, Addenbrooke's Cognitive Examination; pTau217, phospho‐tau‐217; AD, Alzheimer's disease (green); ADAS–Cog, Alzheimer's Disease Assessment Scale–Cognitive; GFAP, glial fibrillary acidic protein; HC, Healthy control (gold); LC, locus coeruleus; NfL, neurofilament light; SN, substantia nigra.
FIGURE 7
FIGURE 7
LC integrity and atrophy rate. (A–C) Scatter plots showing bilateral, left, and right LC contrast against bilateral GM JD, with line of best fit through raw data. (D) Table showing estimates and p values resulting from linear regression models between LC (above) and SN (below) contrast and cortical gray matter JD in AD participants. GM, gray matter; JD, Jacobian determinant; LC, locus coeruleus; SN, substantia nigra.

References

    1. Schwarz LA, Luo L. Organization of the locus coeruleus‐norepinephrine system. Curr Biol. 2015;25(21):R1051–R1056. doi: 10.1016/j.cub.2015.09.039 - DOI - PubMed
    1. Sara SJ. The locus coeruleus and noradrenergic modulation of cognition. Nat Rev Neurosci. 2009;10(3):211–223. - PubMed
    1. Berridge CW, Waterhouse BD. The locus coeruleus‐noradrenergic system: modulation of behavioral state and state‐dependent cognitive processes. Brain Res Rev. 2003;42(1):33–84. - PubMed
    1. Brunello N, Blier P, Judd LL, et al. Noradrenaline in mood and anxiety disorders: basic and clinical studies. Int Clin Psychopharmacol. 2003;18(4):191–202. - PubMed
    1. Weinshenker D. Long road to ruin: noradrenergic dysfunction in neurodegenerative disease. Trends Neurosci. 2018;41(4):211–223. http://ovidsp.ovid.com/ovidweb.cgi?T=JS&PAGE=reference&D&med15&NEWS=N&AN... - PMC - PubMed

LinkOut - more resources