Randomized Controlled Trial
. 2025 Oct;31(10):3330-3340.
doi: 10.1038/s41591-025-03944-9. Epub 2025 Sep 29.

Prevention of type 2 diabetes through prediabetes remission without weight loss

Affiliations
Randomized Controlled Trial

Prevention of type 2 diabetes through prediabetes remission without weight loss

Arvid Sandforth et al. Nat Med. 2025 Oct.

Abstract

Clinical practice guidelines recommend defined weight loss goals for the prevention of type 2 diabetes (T2D) in those individuals with increased risk, such as prediabetes. However, achieving prediabetes remission, that is, reaching normal glucose regulation according to American Diabetes Association criteria, is more efficient in preventing T2D than solely reaching weight loss goals. Here we present a post hoc analysis of the large, multicenter, randomized, controlled Prediabetes Lifestyle Intervention Study (PLIS), demonstrating that prediabetes remission is achievable without weight loss or even weight gain, and that it also protects against incident T2D. The underlying mechanisms include improved insulin sensitivity, β-cell function and increments in β-cell-GLP-1 sensitivity. Weight gain was similar in those achieving prediabetes remission (responders) compared with nonresponders; however, adipose tissue was differentially redistributed in responders and nonresponders when compared against each other-while nonresponders increased visceral adipose tissue mass, responders increased adipose tissue in subcutaneous depots. The findings were reproduced in the US Diabetes Prevention Program. These data uncover essential pathways for prediabetes remission without weight loss and emphasize the need to include glycemic targets in current clinical practice guidelines to improve T2D prevention.


Conflict of interest statement

Competing interests: S.K. receives grants from the German Diabetes Association, Wilhelm Doerenkamp Foundation and California Walnut Commission, and lecture fees from Sanofi, Boehringer Ingelheim, Berlin Chemie, Lilly Deutschland and Juzo Akademie. R.W. receives lecture fees from Eli Lilly, Novo Nordisk and Sanofi, and participates in a Data Safety Monitoring Board and Advisory Board for Eli Lilly. N.P. receives lecture fees from Novo Nordisk and Gesellschaft für Wissenschaftstransfer Dresden, advisory board fees from Bayer Vital and holds patent WO2021/092265A1 for diagnosis and treatment of nonalcoholic fatty liver disease and liver fibrosis. J.J.H. is consulting with Novo Nordisk. N.J.W.A. has received research support and speaker fees from Mercodia, Novo Nordisk, Merck/MSD and Boehringer Ingelheim. All other authors declare no competing interests.

Figures

Fig. 1
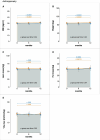
Fig. 1. Oral glucose tolerance test.
a, Time course of glucose (R, n = 51; NR, n = 183) concentrations during the OGTT over the course of the LI. b, Insulin (R, n = 51; NR, n = 183) concentrations during the OGTT over the course of the LI. Means of raw values are depicted with error bars indicating 95% confidence intervals in all panels. P values directly above the x axes indicate change in R versus NR over time (that is, interaction term of group and time) derived from mixed effects models. The R (defined by NGR, that is, prediabetes remission, after 12 months of LI) group and the NR (that is, not reaching NGR) group are depicted in blue and orange, respectively. FDR-corrected group × time P values are 0.0008 for all comparisons. Dashed lines in a represent ADA criteria-based cutoff values for prediabetes for fasting glucose (5.6 mmol l−1) and 2 h OGTT glucose (7.8 mmol l−1). In b, the lower dashed line shows the insulin concentrations at 60 min during the OGTT at baseline and the upper dashed line shows the 60 min peak at 12 months to visualize the change in insulin peak concentrations during the intervention.
Fig. 2
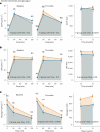
Fig. 2. Insulin sensitivity and secretion.
a, OGIS (R, n = 51; NR, n = 183). b, Matsuda insulin sensitivity index (R, n = 51; NR, n = 183). c, Hepatic insulin resistance (R, n = 51; NR, n = 183). d, Muscle insulin resistance (R, n = 51; NR, n = 183). e, Adipose tissue insulin resistance (R, n = 21; NR, n = 109). f, Insulin secretion (C-peptide/glucose AUC0–30 min—R, n = 51; NR, n = 183). g, Adaptation index (R, n = 51; NR, n = 183). h, The hyperbolic relationship between insulin sensitivity (OGIS) and secretion (C-peptide/glucose AUC0–30 min—R, n = 51; NR, n = 183) all derived from OGTT at baseline and 12 months. i, Hepatic insulin clearance (R, n = 51; NR, n = 183). The R (defined by NGR, that is, prediabetes remission, after 12 months of LI) group and the NR (that is, not reaching NGR) group are depicted in blue and orange, respectively. Means of raw values are depicted with error bars indicating 95% confidence intervals in ag. In h and i, the base of the arrows depicts medians at baseline and the respective tip after 1 year of LI. Error bars depict s.e.m. P values directly above the x axes in ag and i indicate change in R versus NR over time (that is, interaction term of group and time) derived from mixed effects models. P values directly above the colored bars indicate the difference between baseline and 12 months for the R and the NR group as post hoc corrected comparisons derived from the respective mixed effects models. FDR-corrected group × time P = 0.013 (a), P = 0.002 (b), P = 0.89 (c), P = 0.47 (d), P = 0.47 (e), P = 0.10 (f), P = 0.081 (g) and P = 0.62 (i).
Fig. 3
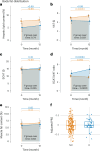
Fig. 3. Body fat distribution.
a, Trajectories of hepatic lipid content as assessed with 1H-MRS (R, n = 51; NR, n = 183). b, VAT as assessed with MRI (R, n = 51; NR, n = 183). c, SCAT as assessed with MRI (R, n = 51; NR, n = 183). d, SCAT/VAT ratio (R, n = 51; NR, n = 183). e, Muscle fat content as assessed with MRI (R, n = 16; NR, n = 27). f, Group comparison of the adjusted PRS for VAT volume (R, n = 32; NR, n = 164). In ae, means of raw values are depicted with error bars indicating 95% confidence intervals. In f, box plots are centered on medians, boxes extend to 25th and 75th percentiles and whiskers extend to 1.5× IQR (top and bottom). P values directly above the x axes in ae indicate change in R versus NR over time (that is, interaction term of group and time) derived from mixed effects models. P values directly above the colored bars indicate the difference between baseline and 12 months for the R and the NR group as post hoc corrected comparisons derived from the respective mixed effects models. The R (defined by NGR, that is, prediabetes remission, after 12 months of LI) group and the NR (that is, not reaching NGR) group are depicted in blue and orange, respectively. FDR-corrected group × time P = 0.83 (a), P = 0.090 (b), P = 0.092 (c), P = 0.0008 (d) and P = 0.89 (e). IQR, interquartile range.
Fig. 4
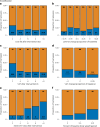
Fig. 4. Stratification of prediabetes remission.
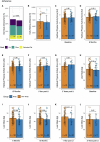
a, Stratification of R (defined by NGR, that is, prediabetes remission, after 12 months of LI, n = 51; blue) and NR (that is, not reaching NGR, n = 183) by postintervention hepatic lipid content as assessed with 1H-MRS. b, Change of hepatic lipid content during LI. c, Postintervention VAT volume as assessed with MRI. d, Change of VAT volume during LI. e, SCAT/VAT ratio. f, Change of body weight during LI. Top numbers inside the bars indicate stratum size (n). Large bottom numbers indicate BMI (a,c) or percent body weight change (b,d,e). Small bottom numbers indicate 95% CI, respectively.
Fig. 5
Fig. 5. Incretin hormones and glucagon.
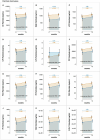
Incretin hormone levels during the OGTT at baseline and 12 months, n = 32 R versus 131 NR. a, GLP-1. b, GIP. c, Glucagon. Means of raw values are depicted with error bars indicating 95% confidence intervals. P values directly above the x axes indicate change in R (defined by NGR, that i,s prediabetes remission, after 12 months of LI) versus NR (that is, not reaching NGR) over time (that is, interaction term of group and time) derived from mixed effects models. Indicators above the time points indicate between-group difference at the respective time point derived from post hoc comparisons of the respective mixed effects models. ***P < 0.0001; FDR-corrected group × time P values: baseline—P = 0.29, 12 months—P = 0.29, AUC—P = 0.0008 (all to a); baseline—P = 0.63, 12 months—P = 0.38, AUC—P = 0.45 (all to b); baseline—P = 0.38, 12 months—P = 0.0079, AUC—P = 0.0012 (all to c). NS, nonsignificant.
Fig. 6
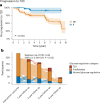
Fig. 6. Progression to type 2 diabetes.
a, Kaplan–Meier curve representing proportion of individuals without T2D over time. Faded colors indicate s.d. from the estimand. P value is derived from log-rank tests. b, Sankey plot of glycemic categories (that is, T2D, prediabetes and NGR) over time. P value is derived from two-sided Fisher’s exact test.
Extended Data Fig. 1
Extended Data Fig. 1. Anthropometric characteristics in PLIS.
Anthropometric characteristics in PLIS: BMI, R: n = 51; NR: n = 183 (a), body weight, R: n = 49; NR: n = 170 (b), lean mass, R: n = 49; NR: n = 170 (c), fat mass R: n = 49; NR: n = 171 (d) and maximal aerobic capacity, R: n = 17; NR: n = 47 (e) during the intervention. Means of raw values are depicted with error bars indicating 95% confidence intervals. P values directly above the x axes indicate change in R versus NR over time (that is, interaction term of group and time) derived from mixed effects models. P values directly above the colored bars indicate the difference between baseline and 12 months for the responder group (blue) and the non-responder group (orange) as post-hoc corrected comparisons derived from the respective mixed effects models. Exact p-values: a: R p = 3.03 × 10−13; NR p < 2 × 10−16; b: R p = 6.67 × 10−13; NR p < 2 × 10−16.
Extended Data Fig. 2
Extended Data Fig. 2. Diet adherence and physical activity.
Assessment of markers of diet adherence and physical activity during and after the lifestyle intervention (LI) in PLIS. a, Adherence to the diet recommendations assessed during diet counseling sessions. b, Daily distance walked inferred by pedometer data after 6 months of LI in a subgroup of individuals (R: n = 6; NR: n = 17). cg, The habitual physical activity score during LI and at follow-up. hl, Lean body mass during LI and at follow-up. Chi-squared test was used for a, all other p values are derived from two-sided Wilcoxon rank sum tests. Means of raw values are depicted and error bars indicate s.d. in bl. N for each panel is depicted in the respective group bars.
Extended Data Fig. 3
Extended Data Fig. 3. Adiponectin and leptin concentrations during the lifestyle intervention.
Concentrations of circulating adiponectin, R: n = 43; NR: n = 169 (a) and R: n = 43; NR: n = 149 (b) before and after the intervention in PLIS. Means of raw values are depicted with error bars indicating 95% confidence intervals. P values directly above the x axes indicate change in R versus NR over time (that is, interaction term of group and time) derived from mixed effects models. P values directly above the colored bars indicate the difference between baseline and 12 months for the responder group (blue) and the non-responder group (orange) and those directly above the panels comparing the group comparisons at each timepoint, all derived from post-hoc corrected comparisons from the respective mixed effects models.
Extended Data Fig. 4
Extended Data Fig. 4. VLDL palmitate subclasses during the livestyle intervention.
VLDL palmitate subclasses, R: n=47; NR: n=169 for all panels, in PLIS. Cholesterol ester palmitate (CE, a), diacylglycerol palmitate (DAG, b), lysophosphatidylcholine palmitate (LPC, c), lysophosphatidylethanolamine palmitate (LPE, d), lysophosphatidylglycerol palmitate (LPG, e), phosphatidylcholine palmitate (PC, f), phosphatidylcholine oxidized palmitate (PCO, g), phosphatidylethanolamine palmitate (PE, h), phosphatidylethanolamine oxidized palmitate (PEO, i), phosphatidylinositol palmitate (PI, j), triacylglycerol palmitate (TAG, k), combined very low-density lipoprotein palmitate (VLDL1, l). Means of raw values are depicted with error bars indicating 95% confidence intervals. P values directly above the x axes indicate change in R versus NR over time (that is, interaction term of group and time) derived from mixed effects models. P values directly above the colored bars indicate the difference between baseline and 12 months for the responder group (blue) and the non-responder group (orange) as post-hoc corrected comparisons derived from the respective mixed effects models.
Extended Data Fig. 5
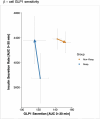
Extended Data Fig. 5. Change in β-cell incretin sensitivity during the lifestyle intervention.
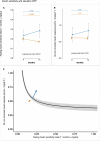
β-cell incretin sensitivity expressed as area under the curve of the insulin secretion rate during the first 30 min of the OGTT plotted against the area under the curve of GLP-1 secretion during the first 30 min of the OGTT. The base of the arrows depicts medians at baseline and the respective tip after 1 year of LI. Error bars depict s.e.m. Arrow base indicates coordinate at baseline, arrow tip indicates coordinate at 12 months for the responder group (blue) and the non-responder group (orange), respectively. R: n = 32; NR: n = 131 in PLIS.
Extended Data Fig. 6
Extended Data Fig. 6. Antropometry in DPP.
BMI, R: n = 25; NR: n = 469 (a) and visceral adipose tissue trajectories, R: n = 8; NR: n = 160 (b, c) in individuals participating in DPP. Means of raw values are depicted with error bars indicating 95% confidence intervals. P values directly above the x axes indicate change in R versus NR over time (that is interaction term of group and time) derived from mixed effects models. P values directly above the colored bars indicate the difference between baseline and 12 months for the responder group (blue) and the non-responder group (orange) as post-hoc corrected comparisons derived from the respective mixed effects models. Exact p-values: a: R, p = 2.13 × 10−6; NR, p = 1 × 10−8; b: NR, p = 5.85 × 10−6.
Extended Data Fig. 7
Extended Data Fig. 7. Insulin sensitivity and secretion DPP.
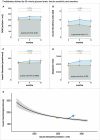
Indexes of insulin sensitivity (a) and insulin secretion (b) in DPP as described in the methods. c, The hyperbolic relationship between insulin sensitivity and secretion. Arrow base indicates coordinate at baseline, arrow tip indicates coordinate at 12 months for the R group (blue) and the NR group (orange), respectively. In panel C, means of raw values are depicted with error bars indicating 95% confidence intervals. The base of the arrows depict medians at baseline and the respective tip after 1 year of LI. P values directly above the x axes indicate change in R versus NR over time (that is, interaction term of group and time) derived from mixed effects models. P values directly above the colored bars indicate the difference between baseline and 12 months for the responder group (blue) and the non-responder group (orange) as post-hoc corrected comparisons derived from the respective mixed effects models. R: n = 25; NR: n = 469 for each panel. Exact p-values: a: NR, p = 2.48 × 10−7.
Extended Data Fig. 8
Extended Data Fig. 8. Prediabetes defined by 60-min glucose levels—insulin sensitivity and secretion.
Indexes of insulin sensitivity (a, b), insulin secretion (c) and beta cell function (d) in PLIS with response defined as return of 60min glucose during the OGTT below 155 mg/dL. P values directly above the x axes indicate change in R versus NR over time (that is, interaction term of group and time) derived from mixed effects models. P values directly above the colored bars indicate the difference between baseline and 12 months for the responder group (blue) and the non-responder group (orange) as post-hoc corrected comparisons derived from the respective mixed effects models. e, The hyperbolic relationship between insulin sensitivity and secretion. Arrow base indicates coordinate at baseline, arrow tip indicates coordinate at 12 months for the R group and the NR group, respectively. Means of raw values are depicted with error bars indicating 95% confidence intervals for a-d. In e, the base of the arrows depict medians at baseline and the respective tip after 1 year of LI. Error bars depict s.e.m. R: n = 61; NR: n = 171 for each panel.
Extended Data Fig. 9
Extended Data Fig. 9. β Coefficients from linear mixed effects models.
β coefficients for group (baseline) and group: time (6 months, 12 months) with 95% confidence intervals from linear mixed effects models reported above. Glucose (a, R: n = 51; NR: n = 183), insulin (b, R: n = 51; NR: n = 183), weight (c, R: n = 51; NR: n = 183), BMI (d, R: n = 51; NR: n = 183), lean mass (e, R: n = 49; NR: n = 170 NR), fat mass (f, n = 49; NR: n = 171), VO2 max (g, R: n = 17; NR: n = 47), insulin sensitivity index (h, R: n = 51; NR: n = 183), oral glucose insulin sensitivity index (i, R: n = 51; NR: n = 183), adipose tissue insulin resistance index (j, R: n = 21; NR: n = 109), muscle insulin resistance index (k, R: n = 51; NR: n = 183), hepatic insulin clearance (l, R: n = 51; NR: n = 183), C-peptide AUC 0-30 min/glucose AUC 0-30min (m, R: n = 51; NR: n = 183), adaptation index of β-cell function (n, R: n = 51; NR: n = 183), hepatic lipid content (o, R: n = 51; NR: n = 183), visceral adipose tissue (p, R: n = 51; NR: n = 183), subcutaneous adipose tissue (q, R: n = 51; NR: n = 183), ratio of subcutaneous to visceral adipose tissue (r, R: n = 51; NR: n = 183), muscle fat (s, R: n = 16; NR: n = 27), glucagon-like peptide 1 (t, R: n = 32; NR: n = 131), gastric inhibitory peptide (u, R: n = 16; NR: n = 27), glucagon (v, R: n = 16; NR: n = 27), adiponectin (w, R: n = 43; NR: n = 169), leptin (x, R: n = 43; NR: n = 149) in PLIS. β-coefficients are depicted as point estimates and 95% confidence intervals.

References

    1. Vollset, S. E. et al. Burden of disease scenarios for 204 countries and territories, 2022–2050: a forecasting analysis for the Global Burden of Disease Study 2021. Lancet403, 2204–2256 (2024). - PMC - PubMed
    1. O’Hearn, M. et al. Incident type 2 diabetes attributable to suboptimal diet in 184 countries. Nat. Med.29, 982–995 (2023). - PMC - PubMed
    1. Sandforth, L. et al. Prediabetes remission to reduce the global burden of type 2 diabetes. Trends Endocrinol. Metab.S1043-2760, 00004-9 (2025). - PubMed
    1. Tabák, A. G., Herder, C., Rathmann, W., Brunner, E. J. & Kivimäki, M. Prediabetes: a high-risk state for diabetes development. Lancet379, 2279–2290 (2012). - PMC - PubMed
    1. Ligthart, S. et al. Lifetime risk of developing impaired glucose metabolism and eventual progression from prediabetes to type 2 diabetes: a prospective cohort study. Lancet Diabetes Endocrinol.4, 44–51 (2016). - PubMed

Publication types