. 2025 Nov;21(11):1547-1562.
doi: 10.1038/s44320-025-00141-1. Epub 2025 Sep 29.

Phosphoproteomics of osimertinib-tolerant persister cells reveals targetable kinase-substrate signatures

Affiliations

Phosphoproteomics of osimertinib-tolerant persister cells reveals targetable kinase-substrate signatures

Hsiang-En Hsu et al. Mol Syst Biol. 2025 Nov.

Abstract

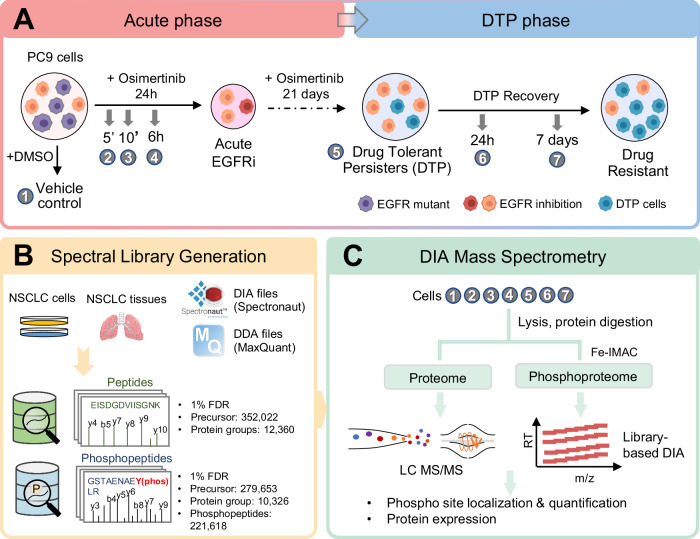
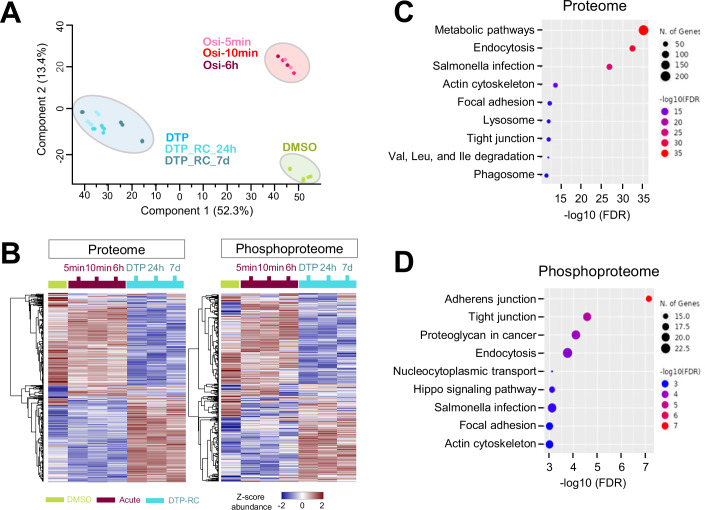
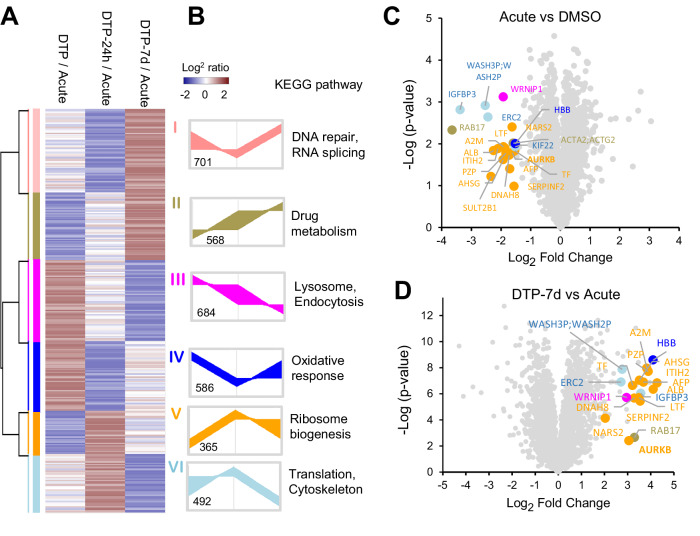
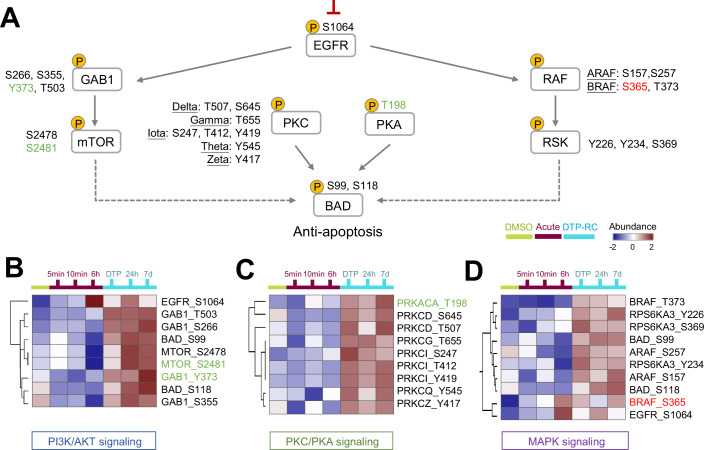
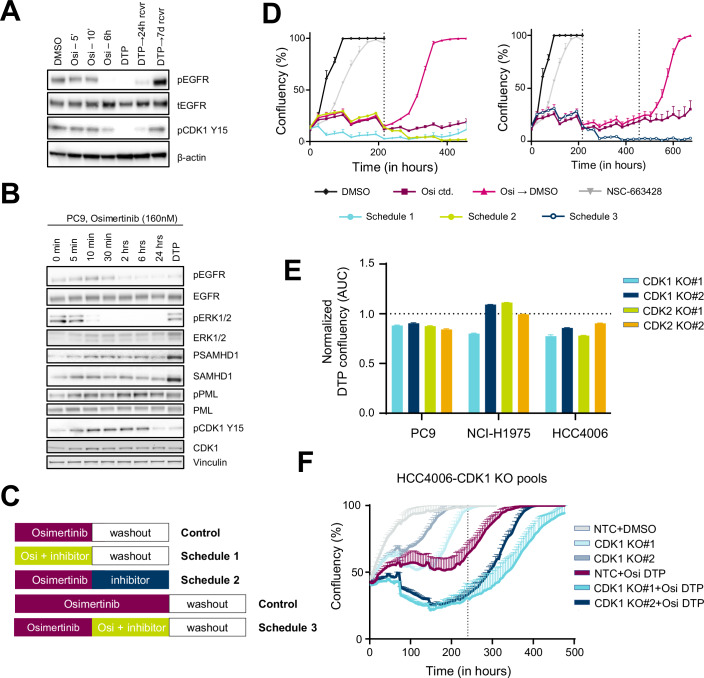
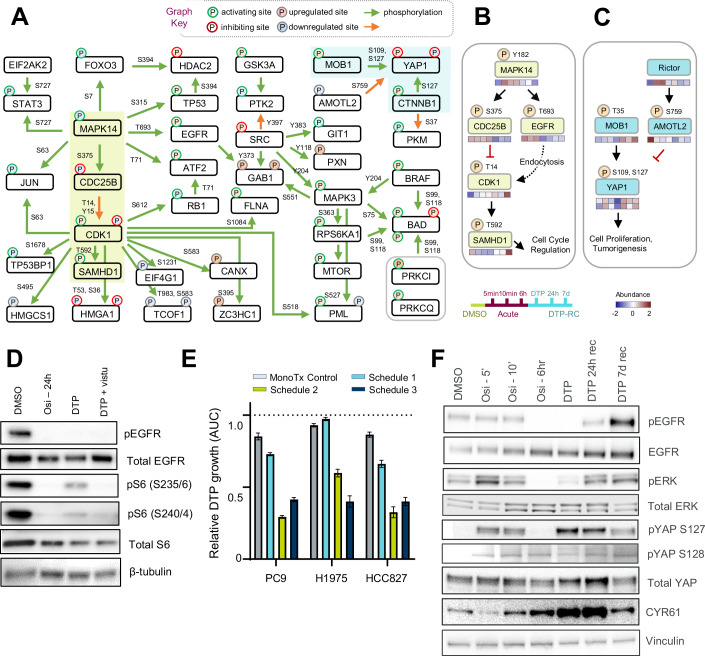
Osimertinib is the first-line therapy for EGFR-mutated non-small cell lung cancer, but acquired resistance emerges in most patients and remains a major barrier for complete cure. This phenomenon is most likely associated with the drug-tolerant persister (DTP) cell phenotype, a reversible state that enables survival under treatment and leads to irreversible drug resistance. To uncover the molecular mechanism driving this distinct phenotype, we applied data-independent acquisition mass spectrometry (DIA-MS) to establish the dynamic proteomic and phosphoproteomic landscape in the osimertinib DTPs. While osimertinib initially blocks EGFR signaling, ribosome synthesis and protein translation related pathways arise in DTP phase, and resistance developed through the reactivation of EGFR downstream pathways and anti-apoptotic mechanisms such as YAP1 and mTOR-BAD hyperphosphorylation, as validated by growth combination assays. Kinase enrichment revealed elevated phosphorylation of multiple CDK1 substrates in DTP phase and pharmacological or genetic inhibition of CDK1-mediated SAMHD1 activation significantly impair DTP growth and survival. This study illuminates the dynamic landscape underlying the DTPs biology and identifies biomarker and new targets to potentially prevent or delay the onset of resistance.

Keywords: Drug Tolerant Persister (DTP); EGFR; Non-Small Cell Lung Cancer (NSCLC); Phosphoproteomics; Proteomics.


Conflict of interest statement

Disclosure and competing interests statement. The authors declare the following financial interests, which may be considered as potential competing interests: MM, SN, and SH are employees of AstraZeneca and may own shares and/or restricted stock of AstraZeneca. SN is an AstraZeneca Postdoctoral Fellow. Chiung-Yun Chang was an employee of AstraZeneca during the conduct of the study and is an employee of Syncell lnc. upon submission of this article; Syncell played no role and made no contribution, financial or otherwise, to the work in this manuscript.

Figures

Figure 1
Figure 1. Phosphoproteomics DIA analysis workflow.
(A) PC9 cells were treated (n = 3) with osimertinib (160 nM) acutely (5 min, 10 min, and 6 h) or for 21 days to generate DTPs. In addition, the drug was washed out of the cells for the recovery phase (24 h, and 7 days). After treatment, proteins were extracted from the cell lysates and were digested with Trypsin/Lys-C. (B) Customized proteome and phosphoproteome spectral libraries for lung cancer were constructed from both DDA and DIA datasets, which were processed by MaxQuant and Spectronaut Pulsar, respectively. (C) For the phosphoproteome, digested lysates (~200 μg) were enriched for phosphopeptides by Fe-IMAC approach prior to LC/MS-MS analysis. Proteome and phosphoproteome data were acquired in DIA mode and analyzed against in-house constructed hybrid spectral libraries.
Figure 2
Figure 2. Proteome and phosphoproteome profiling in response to drug treatment and recovery.
(A) PCA plot for proteome data. (B) Hierarchical clustering of differentially expressed proteins between the proteome and the phosphoproteome. (C) KEGG pathway analysis of differentially expressed proteins (D). KEGG pathway analysis of differentially expressed phosphopeptides.
Figure 3
Figure 3. Protein abundance comparison in the DMSO, acute and DTP recovery phases.
(A) Hierarchical clustering of proteins differentially expressed between acute, DTP, and DTP recovery phases. (B) KEGG pathway enrichment analysis of protein clusters from (A), highlighting representative biological processes. (C) Volcano plot comparing acute vs. DMSO-treated control, showing significantly altered proteins (t test, Benjamini–Hochberg FDR < 0.05, n = 3 biological replicates per group). Twenty candidate proteins were significantly downregulated in the acute phase. (D) Volcano plot comparing DTP-7d recovery vs. acute phase, showing upregulated proteins during recovery (t test, Benjamini–Hochberg FDR < 0.05, n = 3 biological replicates per group).
Figure 4
Figure 4. Phosphoproteomic analysis of osimertinib time-point treatments in NSCLC signaling pathways.
(A) Comprehensive dynamic phosphorylation network of DTPs in the NSCLC signaling pathway. Green labels (e.g., GAB1-Y373, mTOR-S2481, and PKA-T198) denote activating phosphorylation events, whereas red labels (e.g., BRAF-S365) indicate inhibitory phosphorylation. (B) The phosphorylation site dynamics during DTP recovery in the PI3K/AKT signaling pathway. (C) The PKA/PKC signaling pathway shows dynamics of phosphorylation changes during DTP recovery. (D) Phosphorylation dynamics during DTP recovery in the MAPK signaling pathway.
Figure 5
Figure 5. Kinase enrichment analysis reveals a potential CDK regulation pathway.
(A) Heatmap showing the enrichment of substrate groups for the different kinases calculated by the KSEA (https://casecpb.shinyapps.io/ksea/). Only kinases that are shared between the four datasets and that have 5+ substrates are included. Blue color represents negative kinase scores, and red represents positive. Asterisks indicate the scores of P values (*P < 0.1; **P < 0.05). (B) Significantly enriched phosphosites and their corresponding kinases among different time points.
Figure 6
Figure 6. The inhibition of CDK1 function with osimertinib delayed tumor regrowth in vitro.
(A, B) Western blotting against the indicated proteins in the PC9 cell line treated with osimertinib over a range of times. (C) Schematic of DTP growth assay dosing schedules. (D) PC9 cells were treated long-term with the indicated schedules of osimertinib (160 nM) and/or NSC-663284 (1 μM). Growth was assessed as % confluence as measured by the Incucyte imaging platform. The dotted line represents the time point where dosing was changed. Error bars represent standard deviation (SD; n = 3). (E) Relative DTP confluence of CDK1 and CDK2 knockout pools in PC9, H1975, and HCC4006 cells from its DTP growth assays. Cells were treated with osimertinib (160 nM) for 10 days (DTP), followed by drug washout to evaluate regrowth. Growth was assessed as % confluency measured by the Incucyte imaging platform. Bar graphs represent normalized AUC of the plotted growth curves (normalized to the effect observed in non-targeted control (NTC) samples – indicated by dotted line; n = 3). (F) Cell confluence plot for HCC4006 cells transfected with CRISPR constructs targeting CDK1 and treated with 160 nM osimertinib for 10 days, followed by drug washout. NTC indicates non-targeted control (NTC) gRNA transfected samples. Error bars represent SD (n = 3). Source data are available online for this figure.
Figure 7
Figure 7. Systematic phosphorylation model of signaling pathway regulations contributing to drug tolerance.
(A) CausalPath results of differentially phosphorylation profiling between acute and DTP recover 24 h. (B, C) Signaling pathway regulation observed in the DTP recovery model is also reflected in the phosphoproteomic profiles. (D) PC9 cells were treated with osimertinib (160 nM) for 24 h, 14 days (DTP), or 11 days with osimertinib then 3 days with osimertinib + vistusertib (100 nM). (E) PC9, H1975, and HCC827 cells were treated long-term with the varying schedules of osimertinib (160 nM) and/or vistusertib (100 nM), as described in Fig. 6C. Growth was assessed as % confluence as measured by the Incucyte imaging platform. Bar graphs represent the normalized AUC of the plotted confluence. Error bars represent SD (n = 3). (F) PC9 cells were treated with osimertinib (160 nM) for the indicated time points, lysed and subjected to western blotting using the indicated antibodies. Source data are available online for this figure.

References

    1. Ali M, Lu M, Ang HX, Soderquist RS, Eyler CE, Hutchinson HM et al (2022) Small-molecule targeted therapies induce dependence on DNA double-strand break repair in residual tumor cells. Sci Transl Med 14:eabc7480 - PMC - PubMed
    1. Artinian N, Cloninger C, Holmes B, Benavides-Serrato A, Bashir T, Gera J (2015) Phosphorylation of the hippo pathway component AMOTL2 by the mTORC2 kinase promotes YAP signaling, resulting in enhanced glioblastoma growth and invasiveness. J Biol Chem 290:19387–19401 - PMC - PubMed
    1. Babur Ö, Luna A, Korkut A, Durupinar F, Siper MC, Dogrusoz U, Vaca Jacome AS, Peckner R, Christianson KE, Jaffe JD et al (2021) Causal interactions from proteomic profiles: molecular data meet pathway knowledge. Patterns 2:100257 - PMC - PubMed
    1. Bhullar KS, Lagarón NO, McGowan EM, Parmar I, Jha A, Hubbard BP, Rupasinghe HPV (2018) Kinase-targeted cancer therapies: progress, challenges and future directions. Mol Cancer 17:48 - PMC - PubMed
    1. Chmielecki J, Gray JE, Cheng Y, Ohe Y, Imamura F, Cho BC, Lin M-C, Majem M, Shah R, Rukazenkov Y et al (2023) Author Correction: Candidate mechanisms of acquired resistance to first-line osimertinib in EGFR-mutated advanced non-small cell lung cancer. Nat Commun 14:3179 - PMC - PubMed

MeSH terms

LinkOut - more resources