. 2025 Sep 29;26(1):853.
doi: 10.1186/s12864-025-12023-9.

SoMaCX: a complex generative genome modeling framework

Affiliations

SoMaCX: a complex generative genome modeling framework

Timothy James Becker. BMC Genomics. .

Abstract

Background: Somatic structural variations (SVs) are commonly observed in cancer tissue, but remain challenging to discover with short and long read sequencing due to tumor heterogeneity and other technical sequencing factors. Only SVs with a sufficient fraction of reads spanning the event will be detectable, while issues like chromothripsis increase the complexity and resulting interpretation significantly. Because structural variation is difficult to measure and reproduce in vivo, it is logical to make use of simulation frameworks to determine realistic system limitations. Our generative modeling approach called soMaCX uses distributions from data to empower simulations that approach real data.

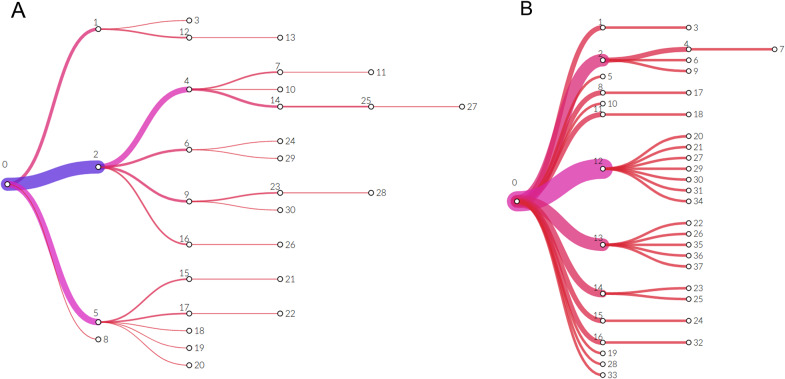
Results: Our generative framework includes mechanisms for biological conservation in the germline as well as tissue composition in the somatic along with regional distribution controls and complex SV generation that is not available in other systems. The output of this system is FASTA format which can then be used as input to any downstream read simulator making Illumina, PacBio, 10X genomics, Oxford-Nanopore and Bionano FASTQ data files which are further processed to become standard BAM files for SV calling.

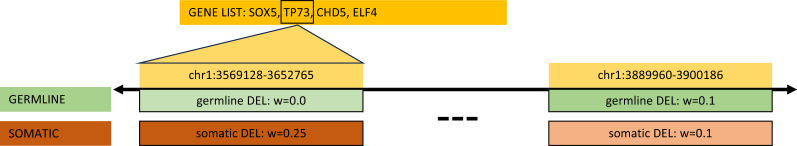
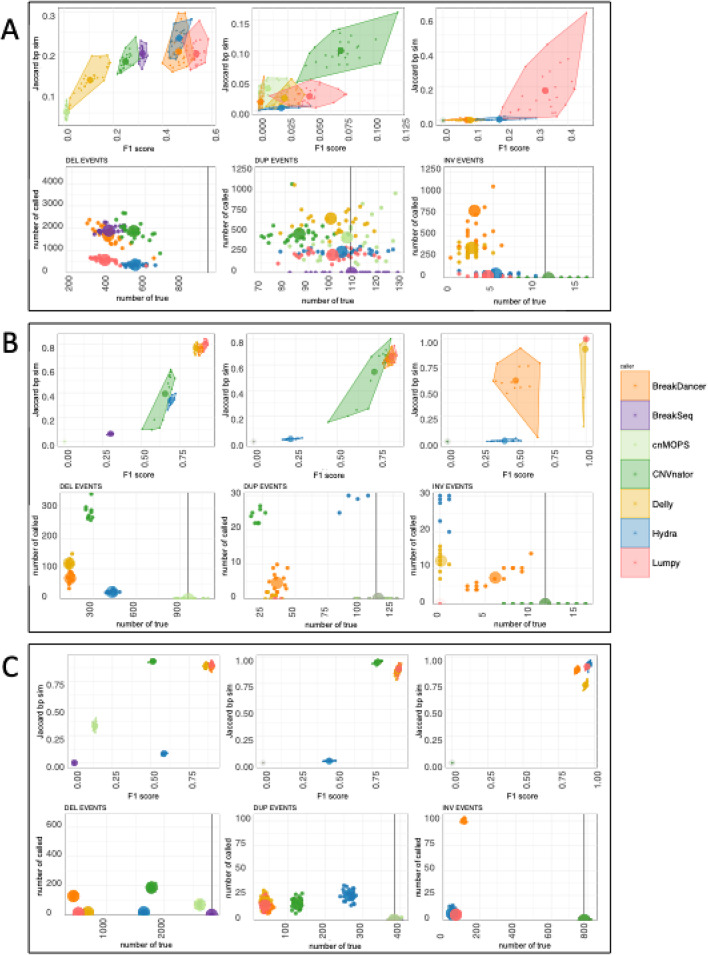
Conclusions: The soMaCX framework provides superior generative modeling-based performance when compared to other simulation frameworks with respect to real data. Our open-source method introduces an important conceptual element to simulation by utilizing biological relevant regions (genes and regulatory elements) as the distribution controls along with the biological modulation of known pathways (end-joining) leading to more detailed and realistic simulated genomes. By designing a generative method to explore the most difficult genomic conditions, we provide a means to measure germline variation calling performance and to calibrate the results for rare variants needed in the clinical setting. We provide a python 3 implementation at: https://github.com/timothyjamesbecker/somacx .

Keywords: FASTA generation.; Generative modeling; Genome simulation; Next generation sequencing; Somatic simulation.


Conflict of interest statement

Declarations. Ethical approval: Not applicable. Consent for publication: Not applicable. Competing interests: The authors declare no competing interests.

Figures

Fig. 1
Fig. 1
Clonal Evolution in the somatic genome can either be simulated by using a JSON configuration file as shown above or can also be simulated using a set of branching and decay parameters ( for branching, for decay). This allows users to build (A) sub-clonal structures which create sparse trees or (B) cancer stem cell structures that are very branchy trees. Here each subclone is given a number where the root is 0 and newer evolved clones will have higher positive integer numbers. Nodes 27, 25, 14, 4, 2, 0 in (A) will have many shared SVs, while nodes 3 and 23 in (B) will share very few alleles
Fig. 2
Fig. 2
SV types include pre-SV substitutions (SNV, MNV), insertions, deletion, duplications, inversions, translocations and finally post-SV substitutions. This allows the user to have SNV and MNV that are in and out of linkage to the DEL, DUP, INV, INS, TRA events. The visualization shows an example of the chance of an SV event per base-pair (the Y axis) along with the chance for a given size (the X axis). These distributions are set within the JSON file. Defaults are included in the soMaCX distribution that are based on the 1000 Genomes Phase 3 rates detected using the SVE and FusorSV framework
Fig. 3
Fig. 3
region (or gene list) distribution: Genomic regions are constructed from either or BED files or genes lists and are assigned to either the gain or loss functional categories. Next these regions are used to formulate the multinomial distribution. Above the oncogene TP73 which is mostly conserved in healthy human tissue is getting an increased chance of generating a somatic SV event with the weight w being increased from 0 (no chance of SV) to 0.25 (a large chance of getting a somatic event). In this way conserved germline genomes can have somatic events or if simulating preexisting conditions such as BRCA1, the healthy germline genomes can begin with some impairments under this framework as well
Fig. 4
Fig. 4
soMaCX complete example workflow: (A) A reference FASTA file is used to generate a human normal genome with soMaCX which is then used as the source for generation of multiple diverging genomes (B) that are influenced by a user defined somatic evolutionary tree, size and type, and finally weighted class units which are individually weighted gene symbol lists or other region data formats such as BED3. The resulting normal FASTA file is ~ 2X the reference size and the resulting tumor FASTA file is ~ f/2 where f is the number of living nodes in the somatic tree. Germline and somatic FASTA files generated from SoMaCX are then given to any FASTA based read platform simulator in (C). This is followed by alignment to generate a BAM or CRAM file which is then given to SNV or SV callers like GATK or FusorSV which provide the estimated VCF file. The estimated VCFs can then be compared with those generated at step A and B to measure system performance or to calibrate probability of individual SV calls
Fig. 5
Fig. 5
(A): SV Caller performance by type for real human samples from the 1000 Genomes Phase 3 high coverage. 27 high coverage samples with 50 average coverage using PCR-free design, 250 bp average read length, 451 bp insert size mean, 125 bp insert size standard deviation. The upper row details two accuracy-based metrics which are the harmonic mean (F1 score) of the precision and recall on the x-axis and the Jaccard base pair similarity metric on the y-axis. The lower row shows the number of true calls against the number of calls made by each caller. (B) soMaCX hybrid normal germline simulation scores using the same format. (C) Varsim data scores are almost perfect and as a result makes this dataset further from the real one in than soMaCX. The visualizations of (A), (B) and (C) indicate differences in measurements of SV callers compared to the true known calls. Since (A) is real data, it represents the best estimates of the 1000 Genomes Phase 3 PCR-free high coverage data which may be missing some real calls due to the methodology that sought to control FDR (but didn’t use an orthogonal sequencing technology)
Fig. 6
Fig. 6
A: TensorSV Model Confusion Matrix for DEL types. The second class or label 1 shows confusion with the lowest value suggesting that these intermediate allele frequencies are challenging for detection. B: TensorSV Model Confusion Matrix for DUP types. Accuracy is lower than DEL overall and fractional alleles are more difficult to detect than the homozygous 0/0 and 1/1 (class 0 and class 3). C: TensorSV Model Confusion Matrix for INV types. Overall performance accuracy is good and confusion is less than with the DEL and DUP types suggesting that simple INV do not represent the reality of the complex variation present in human genomes

References

    1. Greaves M, Maley M. Clonal evolution in cancer. Nature. 2012;481:306–13. - PMC - PubMed
    1. Becker T, et al. FusorSV: an algorithm for optimally combining data from multiple structural variation methods. Genome Biol. 2018;19:38. - PMC - PubMed
    1. The Cancer Genome Atlas Research Network., Weinstein, J., Collisson, E. et al. The Cancer Genome Atlas Pan-Cancer analysis project. Nat Genet45, 1113–1120 (2013). 10.1038/ng.2764. https://www.nature.com/articles/ng.2764#citeas. - PMC - PubMed
    1. Byrska-Bishop M, et al. High-coverage whole-genome sequencing of expanded 1000 genomes project cohort including 602 trios. Cell. 2022;185:3426–40. - PMC - PubMed
    1. The ICGC/TCGA Pan-Cancer Analysis of Whole Genomes Consortium. Pan-cancer analysis of whole genomes. Nature. 2020;578:82–93. - PMC - PubMed

LinkOut - more resources