. 2025 Sep 29;26(1):318.
doi: 10.1186/s13059-025-03796-z.

Benchmarking multi-slice integration and downstream applications in spatial transcriptomics data analysis

Affiliations

Benchmarking multi-slice integration and downstream applications in spatial transcriptomics data analysis

Kejing Dong et al. Genome Biol. .

Abstract

Background: Spatial transcriptomics preserves spatial context of tissues while capturing gene expression. As the technology advances, researchers are increasingly generating data from multiple tissue sections, creating a growing demand for multi-slice integration methods. These methods aim to generate spatially aware embeddings that jointly capture spatial and transcriptomic information, preserving biological signals while mitigating technical artifacts such as batch effects. However, the reliability of these methods varies, and the growing diversity of technologies makes integration even more challenging. This underscores the need for a comprehensive benchmark to evaluate their performance, which is still lacking.

Results: To systematically evaluate the performance of multi-slice integration methods, we propose a comprehensive benchmarking framework covering four key tasks that form an upstream-to-downstream pipeline: multi-slice integration, spatial clustering, spatial alignment, slice representation. For each task, we perform detailed analyses of the methods and provide actionable recommendations. Our results reveal substantial data-dependent variation in performance across tasks. We further investigate the relationships between upstream and downstream tasks, showing that downstream performance often depends on upstream quality.

Conclusions: Our study provides a comprehensive benchmark of 12 multi-slice integration methods across four key tasks using 19 diverse datasets. Our results reveal that method performance is highly dependent on application context, dataset size, and technology. We also identified strong interdependencies between upstream and downstream tasks, highlighting the importance of robust early-stage analysis.

Keywords: Spatial multi-slice integration; Spatial transcriptomics; Systematic benchmark.


Conflict of interest statement

Declarations. Ethics approval and consent to participate: Not applicable. Consent for publication: Not applicable. Competing interests: The authors declare no competing interests.

Figures

Fig. 1
Fig. 1
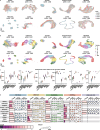
Pipeline and data. a The pipeline of the overall study. b The datasets used in this study are presented, including information on the number of slices, the total number of cells/spots, and the number of cells/spots and genes in each slice. The length of the bars representing cells/spots is proportional to the mean values, with the numbers next to the bars indicating the mean. Error bars represent the standard error across slices within each dataset. The length of the bars for genes is proportional to the number of genes, except for the 10X Visium dataset, where the large gene count is taken into account
Fig. 2
Fig. 2
Benchmarking results for multi-slice integration across multiple slices. a, b Visualization of the multi-slice integration results for each method on the DLPFC S3 dataset. The plots display UMAP embeddings based on the results from each method, with cells colored according to their slice (a) and domain (b) labels. c The boxplots of dASW, dLISI, ILL, bASW, iLISI, and GC for each method on all 3 datasets of 10X Visium dataset. Center line: median; box limits: upper and lower quartiles; whiskers: max or min value no further than 1.5 × interquartile range; arrow: metric dominant direction. d Overall performance of each method on each dataset, with metrics displayed based on their rank across all methods. Methods that failed to run for a particular dataset were assigned a rank of 0. The overall score represents the average rank of the six metrics for each method. The indicator represents the relative value of the corresponding metric for each method after min–max normalization across all methods
Fig. 3
Fig. 3
Benchmarking results for spatial clustering across multiple slices. a Visualization of spatial clustering results for each method on the DLPFC S3 dataset. The plots display spatial coordinates with cells colored according to domain labels, with the ground truth domain on the left and the results from each method on the right. b The boxplots of ARI, NMI, CHAOS, and PAS for each method on all 3 datasets of 10X Visium dataset. Center line: median; box limits: upper and lower quartiles; whiskers: max or min value no further than 1.5 × interquartile range; arrow: metric dominant direction. c Overall performance of each method on each dataset, with metrics displayed based on their rank across all methods. Methods that failed to run for a particular dataset were assigned a rank of 0. The overall score represents the average rank of the four metrics for each method. The indicator represents the relative value of the corresponding metric for each method after min-max normalization across all methods
Fig. 4
Fig. 4
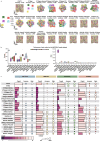
Benchmarking results for spatial alignment. a Visualization of spatial alignment results for each method on the MERFISH Preoptic dataset. The stacking plots display spatial coordinates with cells colored according to slice labels. The original spatial coordinates are shown on the left and the corrected spatial coordinate from each method are shown on the right. b The boxplots of Accuracy and Ratio for each method across 5 slices within MERFISH Preoptic data. Center line: median; box limits: upper and lower quartiles; whiskers: max or min value no further than 1.5 × interquartile range. c Overall performance of each method on each dataset, with metrics displayed based on their rank across all methods. Methods that failed to run for a particular dataset were assigned a rank of 0. The overall score represents the average rank of the two metrics for each method. The indicator represents the relative value of the corresponding metric for each method after min-max normalization across all methods
Fig. 5
Fig. 5
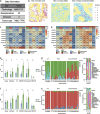
Benchmarking results for slice representation. a The dataset information. b Representative patients from different classes are shown. The plots display spatial coordinates with cells colored according to the ground truth domain labels. c, d The heatmap of ARI and NMI for each method across different settings of the number of identified domains based on hclust (c) and K-means (d) clustering. Rows represent the number of domains, and columns represent different methods. The mean value for each method is calculated by averaging its performance across all domain counts, while the CV is calculated as the ratio of the standard error to the mean value across all domain counts. e, f Bar plots showing ARI (e) and NMI (f) for hierarchical clustering (hclust) and K-means based on domains identified by different integration methods. Bar heights indicate the mean ARI and NMI across various domain count settings for each method, with error bars representing the standard error. p-values (two-sided t-test) reflect the statistical significance of differences between hclust and K-means: ns (not significant), *p ≤ 0.05, **p ≤ 0.01, ***p ≤ 0.001, ****p ≤ 0.0001. g Stacked bar plots illustrating the domain composition across samples, with domains identified by MENDER under the five-domain setting (left), and the cell type composition within each identified domain (right). h Stacked bar plots illustrating the domain composition across samples, with domains identified by PRECAST under the five-domain setting (left), and the cell type composition within each identified domain (right)
Fig. 6
Fig. 6
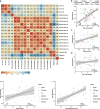
Overall performance analysis of each method across all datasets. a Correlation between datasets about the performance of methods on multi-slice integration. The heatmap shows the Spearman correlation of overall performance across data. Each element (i, j) represents the correlation between dataset i and dataset j. bd The scatter plot shows the rank-based overall scores for multi-slice integration and spatial clustering (b), spatial clustering and spatial alignment (c), multi-slice integration and spatial alignment (d) across all methods and datasets. Each point represents a method’s performance on a specific dataset, with its position determined by the scores for the two tasks. Point colors indicate the corresponding methods. e The scatter plot shows the ARI for spatial clustering and slice representation on the TNBC dataset across all methods with point colors indicating the corresponding methods. f The scatter plot shows cell type based ARI for spatial clustering and ARI for slice representation on the TNBC dataset across all methods with point colors indicating the corresponding methods

References

    1. Moses L, Pachter L. Museum of spatial transcriptomics. Nat Methods. 2022. 10.1038/s41592-022-01409-2. - PubMed
    1. Zhang B, et al. A human embryonic limb cell atlas resolved in space and time. Nature. 2024;635:668–78. 10.1038/s41586-023-06806-x. - PMC - PubMed
    1. Allen WE, Blosser TR, Sullivan ZA, Dulac C, Zhuang X. Molecular and spatial signatures of mouse brain aging at single-cell resolution. Cell 2023;186:194–208. e118. 10.1016/j.cell.2022.12.010. - DOI - PMC - PubMed
    1. Khaliq AM, et al. Spatial transcriptomic analysis of primary and metastatic pancreatic cancers highlights tumor microenvironmental heterogeneity. Nat Genet. 2024;56:2455–65. 10.1038/s41588-024-01914-4. - PubMed
    1. Longo SK, Guo MG, Ji AL, Khavari PA. Integrating single-cell and spatial transcriptomics to elucidate intercellular tissue dynamics. Nat Rev Genet. 2021;22:627–44. 10.1038/s41576-021-00370-8. - PMC - PubMed

LinkOut - more resources