. 2025 Dec;17(1):2555619.
doi: 10.1080/19490976.2025.2555619. Epub 2025 Sep 30.

Intermittent fasting triggers interorgan communication to improve the progression of diabetic osteoporosis

Affiliations

Intermittent fasting triggers interorgan communication to improve the progression of diabetic osteoporosis

Zhiyuan Guan et al. Gut Microbes. 2025 Dec.

Abstract

Diabetic osteoporosis is a disease that seriously affects health, and intermittent fasting is a promising dietary approach to manage diabetes. The objective of our study was to analyze the effects of intermittent fasting on diabetic osteoporosis and its possible mechanisms. Streptozotocin-induced diabetes in mice was treated by intermittent fasting. Micro-CT and Immunostaining techniques were utilized to evaluate glycogen synthesis and morphological changes in the tibia. Gut microbiota analysis involved 16S rRNA gene amplification and sequencing. Liquid chromatography-mass spectrometry was employed, and quantitative real-time PCR assessed gene expression levels. Our study found that intermittent fasting improved blood glucose levels in diabetic mice and simultaneously enhanced cancellous bone microstructure, including BMD, BV/TV, Tb.Th, and Tb.Sp, which was revised by intervention with intermittent fasting. Intermittent fasting increased Christensenellaceae Chr) flora abundance. To further validate the role of Chr in diabetic osteoporosis treated with intermittent fasting, we used a gut microbiota transplanting and elimination experiment and Chr supplementation experiment, and the result found that Chr supplementation improved bone mass and microstructure in diabetic osteoporosis mice. In addition, Christensenellaceae facilitated the release of exosomes, which promote osteoclast activity, and exosome sequencing analysis showed miR551b upregulation in Christensenellaceae-derived exosomes, and the miR551b improves bone parameters in diabetic osteoporosis mice by supplement or inhibiting miR551b experiments. In conclusion, our study highlights the role of intermittent fasting in improving osteoporosis in diabetes by regulating changes in the abundance of Chr in the gut microbiota and improving the exosomes miR551b secreted by Chr, which in turn improves osteoblast activity. These findings provide a mechanism of intermittent fasting in managing osteoporosis via the gut microbiota-bone axis, potentially leading to innovative therapeutic approaches for diabetes-mediated osteoporosis.

Keywords: Christensenellaceae; Osteoporosis; diabetes mellitus; exosome; intermittent fasting; miR-551b.

Plain language summary

* “What is already known on this topic?” Diabetes often leads to bone metabolism disorders, and intermittent fasting can have a significant impact on the body’s metabolic state.* “What this study adds” Intermittent fasting led to significant improvements in blood glucose levels and bone mass in diabetic mice, as evidenced by enhanced cancellous bone microstructure parameters such as BMD, Tb.Sp, BV/TV, and Tb.Th.Intermittent fasting increased the abundance of Christensenellaceae flora, and KEGG pathway analysis revealed that RNA processing and modifications play a critical role in this process.Supplementation with Christensenellaceae-derived exosomes, compared to Lactobacillus-derived exosomes, showed superior effects on bone microstructure. The inhibition of miR-551b and the use of exosome inhibitors like GW4869 further demonstrated the role of miR-551b in bone healing.* “How this study might affect research, practice or policy” Our findings support the mechanism of intermittent fasting in managing osteoporosis via the gut microbiota-exosome-bone axis, potentially leading to innovative therapeutic approaches for diabetes-mediated osteoporosis.


Conflict of interest statement

No potential conflict of interest was reported by the author(s).

Figures

None
Graphical abstract
Figure 1.
Figure 1.
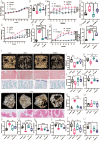
Intermittent fasting improves progress in diabetic osteoporotic mice. (A) body weight. (B) body weight gain. (C)food intake. (D)change of food intake. (E)water intake. (F)change of water intake. (G) serum glucose. (H) change of glucose. (I) Representative diagram of IF-treated diabetic osteoporotic mice. (J)BMD of fourth lumbar vertebrae. (K)tb.N of fourth lumbar vertebrae. (L)tb.Th fourth lumbar vertebrae. (M)BV/TV/BW of the fourth lumbar vertebrae. (N)tb.Sp of the fourth lumbar vertebrae. (O)length of femur. (P)tb.Sp of the femur. (Q) BV/TV/BW of femur. (R)tb.N of femur. (S)tb.Th femur. (T) Ct.Th femur. (U) Ct.Ar/Tt.Ar of femur. Data are presented as mean ± SEM, and statistical significance was determined by two-way ANOVA with Newman-Keuls multiple comparisons test, n = 12 mice per group, *p < 0.05, **p < 0.01.
Figure 2.
Figure 2.
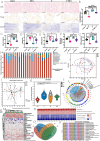
Intermittent fasting intervention modulates gut microbiota alterations in diabetic mice. (A) Representative diagram of HE stain, trap stain, and OCN immunohistochemistry stain.(B)N.Obs/BS.(C)ostrocalcin.(D)MAR.(E)BFR.(F)maximum force. (G) stiffness. (H)community barplot analysis. (I)principal cause analysis.(J)Typing analysis on phylum level. (K)microbiotal dysbiosis index. (L) correlation analysis of intestinal microbiota.(M) heatmap analysis.(N) feature enrichment analysis.(O) venn plot. (P) COG function classification. Data are presented as mean ± SEM and statistical significance was determined by two-way ANOVA with Newman-Keuls multiple comparisons test, n = 12 mice per group, *p < 0.05, **p < 0.01.
Figure 3.
Figure 3.
Effects of Chr supplementation on diabetes-induced osteoporosis. (A) Representative diagram of bone microstructure, HE stain, OCN stain. (B)BMD of the fourth lumbar vertebrae. (C)BV/TV/BW of the fourth lumbar vertebrae. (D)tb.Th of fourth lumbar vertebrae. (E)tb.N of fourth lumbar vertebrae. (F)tb.Sp of the fourth lumbar vertebrae. (G) Tb.Th of femur. (H)tb.N of femur. (I)tb.Sp of femur. (J) BV/TV/BW of femur. (K)length of femur. (T) Ct.Th femur. (U) Ct.Ar/Tt.Ar of femur. (O)CD4+ T lymphocytes. (P) histogram of intestinal microbiota composition. (Q)the total load of gut microbiota. (R) Escherichia coli relative abundance. (S)christensenellaceae relative abundance. Data are presented as mean ± SEM, and statistical significance was determined by two-way ANOVA with Newman-Keuls multiple comparisons test, n = 12 mice per group, *p < 0.05, **p < 0.01.
Figure 4.
Figure 4.
Effects of fecal transplantation assays and gut microbiota elimination assays on diabetes-mediated osteoporosis. (A) Representative diagram of bone microstructure, HE stain, OCN stain of fecal transplantation assays, and gut microbiota elimination experiment. (B)tb.Sp of the fourth lumbar vertebrae. (C)tb.Th of fourth lumbar vertebrae. (D)tb.N of fourth lumbar vertebrae. (E)BV/TV/BW of the fourth lumbar vertebrae. (F)BMD of the fourth lumbar vertebrae. (G)tb.Sp of femur.(H) Tb.Th femur. (K)TRAP expression. (L)OCN expression. (M) femur BMD in gut microbiota elimination assays. (N) BV/TV/BW of femur in gut microbiota elimination assays. (O)tb.N of femur in gut microbiota elimination assays. (P) Tb.undefined.The femur of in gut microbiota elimination assays. (Q) Tb.Sp of femur in gut microbiota elimination assays. (R) BMD of the fourth lumbar vertebrae in gut microbiota elimination assays. (S)serum LPS. (T) correlated BV/TV with LPS level. Data are presented as mean ± SEM, and statistical significance was determined by two-way ANOVA with Newman-Keuls multiple comparisons test, n = 12 mice per group, *p < 0.05, **p < 0.01.
Figure 5.
Figure 5.
Chr-derived exosomes may play a role in regulating diabetic osteoporosis. (A) Representative diagram of bone microstructure and HE stain. (B) the total load of gut microbiota. (C) total protein contents and D) particle numbers of EVs from GM treated with vehicle or GW4869 for 4 days, or from GM pretreated with vehicle or GW4869 for 4 days and cultured in fresh medium without vehicle or GW4869 for another 4 days. n = 3 per group. (E)BMD of the fourth lumbar vertebrae. (F)tb.N of fourth lumbar vertebrae. (G)tb.Th of fourth lumbar vertebrae. (H)tb.Sp of the fourth lumbar vertebrae. (I)BV/TV/BW of the fourth lumbar vertebrae. (J) Representative diagram of exosome electron microscopy results. (K) Ct.Ar/Tt.Ar of femur. (M) Ct.Th of femur. (N)length of femur.(O) morphological analysis. (P-S)EVs markers of CD9, CD63, and CD81. (T-U) femur and tibia fluorescence. Data are presented as mean ± SEM, and statistical significance was determined by two-way ANOVA with Newman-Keuls multiple comparisons test, n = 12 mice per group, *p < 0.05, **p < 0.01.
Figure 6.
Figure 6.
Chr source mir-551b in the regulation of osteoclast activity. (A) confocal microscopy analysis of the femoral sections from mice treated with the PKH67-labeled EVs for 1 h by oral route(top line) and Representative images of the Chr-EVs antibody (ab)-stained(bottom line). (B-C) quantification of the fluorescent signals in PKH67-labeled EVs and Chr-EVs antibody (ab)-stained. (E) Principal cause analysis of miRNA analysis. (F) volcano map miRNA analysis. (G) KEGG. (H) heatmap of miRNA analysis. (I) relative of four miRNA levels. (J) relative of miR-551b level in EV. (K)relative of miRNA-551b level after depletion of EV. (L) relative of miR-551b level after treatment with miR-551b mimics and inhibitors.(M)ALP activity. (N) OD value. (O) relative OCN mRNA. (P)relative ALP mRNA. Data are presented as mean ± SEM, and statistical significance was determined by two-way ANOVA with Newman-Keuls multiple comparisons test, n = 12 mice per group, *p < 0.05, **p < 0.01.
Figure 7.
Figure 7.
Reversal of EVs amelioration diabetic osteoporosis after miR-551b inhibition. (A) Representative diagram of bone microstructure and HE stain.(B) relative Runx2 mRNA. (C)BMD of the fourth lumbar vertebrae. (D)tb.N of fourth lumbar vertebrae. (E)BV/TV/BW of the fourth lumbar vertebrae. (F)tb.Th fourth lumbar vertebrae. (G)tb.Sp of the fourth lumbar vertebrae. (H)CTX-1. (I) N.Obs/BS. (J)osteocalcin. (K) N.Obs/BS. (L)MAR. (M) BFR/BS. Data are presented as mean ± SEM, and statistical significance was determined by two-way ANOVA with Newman-Keuls multiple comparisons test, n = 12 mice per group, *p < 0.05, **p < 0.01.

References

    1. Sun H, Saeedi P, Karuranga S, Pinkepank M, Ogurtsova K, Duncan BB, Stein C, Basit A, Chan JCN, Mbanya JC, et al. IDF diabetes Atlas: global, regional and country-level diabetes prevalence estimates for 2021 and projections for 2045. Diabetes Res Clin Pract. 2022;183:109119. doi: 10.1016/j.diabres.2021.109119. - DOI - PMC - PubMed
    1. Ferrari SL, Abrahamsen B, Napoli N, Akesson K, Chandran M, Eastell R, El-Hajj Fuleihan G, Josse R, Kendler DL, Kraenzlin M, et al. Diagnosis and management of bone fragility in diabetes: an emerging challenge. Osteoporos Int. 2018;29(12):2585–27. doi: 10.1007/s00198-018-4650-2. - DOI - PMC - PubMed
    1. Xu Y, Wu Q.. Trends in osteoporosis and mean bone density among type 2 diabetes patients in the US from 2005 to 2014. Sci Rep. 2021;11(1):3693. doi: 10.1038/s41598-021-83263-4. - DOI - PMC - PubMed
    1. Ebeling PR, Nguyen HH, Aleksova J, Vincent AJ, Wong P, Milat F. Secondary osteoporosis. Endocr Rev. 2022;43(2):240–313. doi: 10.1210/endrev/bnab028. - DOI - PubMed
    1. Khosla S, Hofbauer LC. Osteoporosis treatment: recent developments and ongoing challenges. Lancet Diabetes Endocrinol. 2017;5(11):898–907. doi: 10.1016/S2213-8587(17)30188-2. - DOI - PMC - PubMed

MeSH terms

LinkOut - more resources