. 2025 Sep 30:13:RP98221.
doi: 10.7554/eLife.98221.

A drug repurposing approach reveals targetable epigenetic pathways in Plasmodium vivax hypnozoites

Affiliations

A drug repurposing approach reveals targetable epigenetic pathways in Plasmodium vivax hypnozoites

Steven P Maher et al. Elife. .

Abstract

Radical cure of Plasmodium vivax malaria must include elimination of quiescent 'hypnozoite' forms in the liver; however, the only FDA-approved treatments are contraindicated in many vulnerable populations. To identify new drugs and drug targets for hypnozoites, we screened the Repurposing, Focused Rescue, and Accelerated Medchem (ReFRAME) library and a collection of epigenetic inhibitors against P. vivax liver stages. From both libraries, we identified inhibitors targeting epigenetics pathways as selectively active against P. vivax and P. cynomolgi hypnozoites. These include DNA methyltransferase inhibitors as well as several inhibitors targeting histone post-translational modifications. Immunofluorescence staining of Plasmodium liver forms showed strong nuclear 5-methylcystosine signal, indicating liver stage parasite DNA is methylated. Using bisulfite sequencing, we mapped genomic DNA methylation in sporozoites, revealing DNA methylation signals in most coding genes. We also demonstrated that methylation level in proximal promoter regions as well as in the first exon of the genes may affect, at least partially, gene expression in P. vivax. The importance of selective inhibitors targeting epigenetic features on hypnozoites was validated using MMV019721, an acetyl-CoA synthetase inhibitor that affects histone acetylation and was previously reported as active against P. falciparum blood stages. In summary, our data indicate that several epigenetic mechanisms are likely modulating hypnozoite formation or persistence and provide an avenue for the discovery and development of improved radical cure antimalarials.

Keywords: DNA methylation; P. cynomolgi; P. falciparum; P. vivax; Plasmodium cynomolgi; Plasmodium vivax; biochemistry; chemical biology; hypnozoites; infectious disease; malaria; microbiology; primary hepatocytes; rhesus macaque.


Conflict of interest statement

SM, MB, AV, CA, MG, YA, MA, MC, AC, AC, WC, CC, MG, HJ, SJ, TL, SL, JM, AO, VP, KP, JP, JP, CR, AR, SS, CS, JS, SS, SS, RU, YW, PW, JY, JP, CM, CJ, FN, BW, KL, DK No competing interests declared, EF, AH, SM AH-C, VC, ELF, and SAM are employees of the Novartis Institute for Tropical Disease, BC BC is an employee of MMV, VC AH-C, VC, ELF, and SAM are employees of the Novartis Institute for Tropical Disease,, KC, TM TM and KC are employees of BioIVT

Figures

Figure 1.
Figure 1.. Hypnozonticidal hit detection and confirmation.
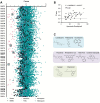
(A) Index chart depicting the primary screen of the ReFRAME library against P. vivax hypnozoites in an 8-day assay. Hypnozoite counts were normalized by mean quantity per well for each plate (Z-score). Teal: library, black: DMSO, red: 1 μM monensin. (B) Dose–response curves for cadralazine against P. vivax and P. cynomolgi liver forms in 8-day assays at the IPC, UGA, and NITD. All replicate wells were plotted together from all independent experiments (n = 3 for P. vivax at IPC, n = 1 for P. vivax at NITD, n = 2 for P. cynomolgi at UGA, and n = 4 for P. cynomolgi at NITD), bars represent SEM.
Figure 1—figure supplement 1.
Figure 1—figure supplement 1.. ReFRAME screen run detail and hit structures.
(A) Index chart from Figure 1A with phosphatidylinositol 4-kinase inhibitor (PI4Ki) KDU691 or MMV390048, tafenoquine, and atovaquone controls added. Teal circle: library, black square: DMSO, pink triangle: 1 μM monensin, light green inverted triangle: 1 μM P4Ki, black diamond: 1 μM atovaquone, purple square: 10 μM tafenoquine. Some hits discussed in this report are noted with black circles; P: poziotinib, B: budralazine, H: hydralazine, C: cadralazine. (B) Simple linear regression correlating Z-factor with average hypnozoite count per well. (C) Structures of hits which confirmed to be active against P. vivax hypnozoites in dose–response assays; blue: hydralazine analogs, purple: other novel hits, green: re-discovery of compounds previously demonstrated to have hypnozonticidal activity in vitro or antirelapse activity in vivo.
Figure 1—figure supplement 2.
Figure 1—figure supplement 2.. Select ReFRAME hits confirmed at Novartis Institute for Tropical Diseases (NITD).
Dose–response curves for hydralazine and poziotinib against P. vivax liver forms assayed at NITD. All replicate wells were plotted together from a single independent experiment, bars represent SEM.
Figure 1—figure supplement 3.
Figure 1—figure supplement 3.. Pharmacokinetics of cadralazine in nonhuman primates.
Mean plasma concentration of cadralazine was measured in three male rhesus macaques after oral dosing. Plasma was collected following a 1 mg/kg dose, and again following a 30 mg/kg dose. Bars represent SD. The approximate IC50 and IC90 from P. vivax hypnozoite assays are indicated.
Figure 2.
Figure 2.. Synergistic effect of cadralazine and 5-azacytidine in P. vivax liver stage assays.
(A) Isobologram of cadralazine and 5-azacytidine activity against hypnozoites in fixed ratios of 1:0, 8:1, 6:1, 4:1, 2:1, 1:1, 1:2, 1:4, 1:6, 1:8, and 0:1, bars represent SD of FICs from two independent experiments. (B) Dose–response curves for cadralazine at the most synergistic fixed ratios (2:1, 4:1, and 8:1) against hypnozoites. Cadralazine alone is represented as 1:0, 5-azacytidine alone is represented as 0:1 and plotted on the cadralazine chart for comparison. Left and right charts represent two independent experiments, bars represent replicate wells at each dose.
Figure 2—figure supplement 1.
Figure 2—figure supplement 1.. Synergistic effect of cadralazine and 5-azacytidine in P. vivax liver stage assays.
Dose–response curves for cadralazine with all fixed ratios of 5-azacytidine against P. vivax hypnozoites. Cadralazine alone is represented as 1:0, 5-azacytidine alone is represented as 0:1 and plotted on the cadralazine chart for comparison. Left and right charts represent two independent experiments.
Figure 3.
Figure 3.. Cytosine modifications in P. vivax liver forms.
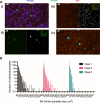
(A) Immunofluorescent imaging of a 5mC-positive (left) or 5hmC-negative (right) P. vivax hypnozoite (top) and schizont (bottom) at day 6 post-infection. White arrows indicate hepatocyte nuclei positive for 5mC or 5hmC. Bars represent 10 µm. (B) High-content quantification of 5mC or 5hmC stain area within hypnozoites or schizonts from sporozoites generated from three different P. vivax cases. Significance determined using Kruskal–Wallis tests, for hypnozoites H(7) = 194.3, p < 0.0001, for schizonts H(7) = 88.66, p < 0.0001, with Dunn’s multiple comparisons, *p < 0.05, ***p < 0.001, ****p < 0.0001, ns = not significant. Line, box, and whiskers represent median, upper and lower quartiles, and minimum-to-maximum values, respectively, of all hypnozoites (177 ≤ n ≤ 257) or all schizonts (30 ≤ n ≤ 142) in culture for each case, 2’ indicates a secondary stain only control.
Figure 3—figure supplement 1.
Figure 3—figure supplement 1.. Cytosine modifications in P. vivax liver forms, full panels from case 1 (expanded from Figure 3).
(A) Immunofluorescent imaging of a 5mC-positive P. vivax hypnozoite (top) and schizont (bottom) at day 6 post-infection. (B) Immunofluorescent imaging of a 5hmC-negative P. vivax hypnozoite (top) and schizont (bottom) at day 7 post-infection. Yellow arrows indicate autofluorescence in the blue channel associated with cell debris above the hepatocyte monolayer. White arrows indicate hepatocyte nuclei which are dimly stained with Hoechst 33342 and positive for 5mC or 5hmC. Purple arrows indicate 5mC-positive foci within the parasite. Bars represent 20 µm.
Figure 3—figure supplement 2.
Figure 3—figure supplement 2.. Cytosine modifications in P. vivax liver forms, full panels from case 2.
(A) Immunofluorescent imaging of a 5mC-positive P. vivax hypnozoite (top) and schizont (bottom) at day 6 post-infection. (B) Immunofluorescent imaging of a 5hmC-negative P. vivax hypnozoite (top) and schizont (bottom) at day 7 post-infection. Yellow arrows indicate autofluorescence in the blue channel associated with cell debris above the hepatocyte monolayer. White arrows indicate hepatocyte nuclei which are dimly stained with Hoechst 33342 and positive for 5mC or 5hmC. Purple arrows indicate 5mC-positive foci within the parasite. Bars represent 20 µm.
Figure 3—figure supplement 3.
Figure 3—figure supplement 3.. Cytosine modifications in P. vivax liver forms, full panels from case 3.
(A) Immunofluorescent imaging of a 5mC-positive P. vivax hypnozoite (top) and schizont (bottom) at day 6 post-infection. (B) Immunofluorescent imaging of a 5hmC-negative P. vivax hypnozoite (top) and schizont (bottom) at day 7 post-infection. Yellow arrows indicate autofluorescence in the blue channel associated with cell debris above the hepatocyte monolayer. White arrows indicate hepatocyte nuclei which are dimly stained with Hoechst 33342 and positive for 5mC or 5hmC. Purple arrows indicate 5mC-positive foci within the parasite. Bars represent 20 µm.
Figure 3—figure supplement 4.
Figure 3—figure supplement 4.. High-content analysis of cytosine modifications and P. vivax liver stage population metrics.
(A) Masks used to quantify parasite area and 5mC or 5hmC signal, (i) raw image taken with a 20x objective, (ii) Mask for P. vivax liver stages, (iii) mask for 5mC or 5hmC signal, and (iv) intersection of parasite mask (light blue) and 5mC or 5hmC signal mask (yellow), leading to quantified area of signal per form. (B) Histogram of growth area all parasites quantified for Cases 1, 2, and 3 in Figure 3. Hypnozoites were classified as forms with an area of 125 µm2 and smaller.
Figure 3—figure supplement 5.
Figure 3—figure supplement 5.. Cytosine modifications in P. cynomolgi M/B strain liver forms.
(A) Immunofluorescent imaging of a 5mC-positive P. cynomolgi hypnozoite (top) and schizont (bottom) at day 8 post-infection. (B) Immunofluorescent imaging of a 5hmC-negative P. cynomolgi hypnozoite (top) and schizont (bottom) at day 8 post-infection. Yellow arrows indicate autofluorescence in the blue channel associated with cell debris above the hepatocyte monolayer. White arrows indicate hepatocyte nuclei which are dimly stained with Hoechst 33342 and positive for 5mC or 5hmC. Purple arrows indicate 5mC-positive foci within the parasite. Bars represent 20 µm. (C) High-content quantification of 5mC or 5hmC stain area within hypnozoites or schizonts. Experiment 1 was fixed at day 8 post-infection, Experiment 2 was fixed at day 12 post-infection. Significance was determined using Kruskal–Wallis tests for hypnozoites and schizonts, with Dunn’s multiple comparisons, ****p < 0.0001, ns = not significant. Line, box, and whiskers represent median, upper and lower quartiles, and minimum-to-maximum values, respectively, of all hypnozoites (124 ≤ n ≤ 712) or all schizonts (7 ≤ n ≤ 581) in culture, 2’ indicates a secondary stain only control. Images in A, B are from Experiment 1.
Figure 4.
Figure 4.. Density of cytosine and methylated cytosine (5mC) in sporozoites.
(A) CG content of chromosome 1 for P. vivax and P. cynomolgi. The total number of cytosines was quantified on each strand using 1 kbp long non-overlapping windows. (B) The total number of methylated cytosines was quantified on each strand using 1 kbp long non-overlapping windows. (C) The number of 5mC present in all possible contexts (CG, CHG, and CHH) quantified throughout the genome of P. vivax and P. cynomolgi. (D) Repartitioned 5mC quantity within different compartments of the genome in P. vivax and P. cynomolgi. (E) Strand specificity of 5mC for all genes in P. vivax and P. cynomolgi. Flanking regions and gene bodies were divided into five bins, and the methylation level of each bin was averaged among all genes. Red: template strand, blue: non-template strand. (F) The previously reported mRNA abundance of P. vivax sporozoites was retrieved (Antonova-Koch et al., 2018) and genes ranked. The 5mC levels in 5′ flanking regions, gene bodies, and 3′ flanking regions were placed into five bins and are shown for highly expressed (90th percentile, left) and weakly expressed (10th percentile, right) genes. Red: template strand, blue: non-template strand.
Figure 4—figure supplement 1.
Figure 4—figure supplement 1.. Measurement of DNA methylation and DNA methyltransferase (DNMT) in P. vivax and P. cynomolgi sporozoites.
(A) Liquid chromatography–tandem mass spectrometry (LC–MS/MS) analysis of 5mC or 5hmC from enzymatically digested gDNA from P. vivax sporozoites, P. cynomolgi sporozoites, and P. falciparum blood stage parasites, as well as negative controls including uninfected mosquito salivary glands and ovaries from the same colony of mosquitoes used to generate the respective sporozoites. Bars represent SD of two independent experiments. (B) DNMT activity measured from nuclear extracts of P. vivax sporozoites, P. cynomolgi sporozoites, and uninfected mosquito salivary glands using the Epiquick DNMT activity assay. Data are from a single experiment.
Figure 4—figure supplement 2.
Figure 4—figure supplement 2.. Cytosine and methylation density plots for P. vivax sporozoites.
(A) CG content of chromosome 1–14 (Chr 1–14). The total number of cytosines quantified on each strand using 1 kb long non-overlapping windows. (B) The total number of methylated cytosines quantified on each strand using 1 kb long non-overlapping windows.
Figure 4—figure supplement 3.
Figure 4—figure supplement 3.. Cytosine and methylation density plots for P. cynomolgi sporozoites.
(A) CG content of chromosome 1–14 (Chr 1–14). The total number of cytosines quantified on each strand using 1 kb long non-overlapping windows. (B) The total number of methylated cytosines quantified on each strand using 1 kb long non-overlapping windows.
Figure 5.
Figure 5.. Characterization of primary human hepatocyte (PHH) metabolism following 1-aminobenzotriazole (1-ABT) treatment.
PHH lot BGW was seeded in 384-well plates and cultured for 7 days before treatment with 100 μM 1-ABT for 1 hr, followed by addition of substrates for 1 hr and collection for analysis by mass spectrometry. Data are combined from two independent experiments, bars represent SD of all replicates. Significance determined by Student’s t tests, ****p < 0.0001, ***p < 0.001, **p < 0.01, ns, not significant.
Figure 5—figure supplement 1.
Figure 5—figure supplement 1.. Monensin activity in all control wells based on primary human hepatocyte (PHH) lot.
(A) Initially, the ReFRAME was screened with cryopreserved vials of a specific lot of PHH, UBV. Screening continued with a new lot, BGW, once the supply of UBV vials was exhausted. The activity of monensin was significantly reduced in wells with BGW versus UBV PHH. A Mann–Whitney test indicates the difference was statistically significant, U(NUBV = 105, NBGW = 41) = 552, z = –2.15, ****p < 0.0001. (B) Metabolic activity panel for PHH lots UBV and BGW performed as part of regular quality control at the vendor (BioIVT). ECOD: 7-ethoxycoumarin O-deethylation, UGT: 7-hydroxycoumarin glucuronidation, ST: 7-hydroxycoumarin sulfation, CYP 1A2: phenacetin O-deethylation, CYP 2A6: coumarin 7-hydroxylation, CYP 2B6: bupropion hydroxylation, CYP 2C8: amodiaquine N-desethylation, CYP 2C9: tolbutamide methyl-hydroxylation, CYP 2C19: S-mephenytoin 4′-hydroxylation, CYP 2D6: dextromethorphan O-demethylation, CYP 2E1: chlorzoxazone 6-hydroxylation, CYP 3A4 (T): testosterone 6β-hydroxylation, CYP 3A4 (M): midazolam 1-hydroxylation. (C) PHH lot BGW was seeded into 384-well plates and cultured for 7 days before addition of a dilution series of 1-aminobenzotriazole (1-ABT) in media. Cytochrome P450 3A4 activity (CYP3A4) was measured using luciferin-IPA (Promega). RLU: relative luminescence units. Bars represent SD of quadruplicate wells. Data are representative of two independent experiments. (D) PHH lot BGW was cultured in 384-well plates before addition of 25 μM rifampicin in media on days 4 and 6 to induce CYP3A4 expression. At day 7 post-seed, CYP3A4 activity was measured by adding luciferin-IPA and a dilution series of 1-ABT in media. Fold change was calculated based on matching uninduced controls. Data are from one independent experiment.
Figure 5—figure supplement 2.
Figure 5—figure supplement 2.. ReFRAME hits re-confirmed in a P. vivax 12-day 1-aminobenzotriazole (1-ABT) assay.
(A) Hypnozonticidal potency comparison of 12 ReFRAME hits in 8- and 12-day 1-ABT dose–response confirmation assays. Cadralazine, plasmocid, and pidralazine potencies were unaffected by assay version, while MS-0735 was less potent, and poziotinib was more potent, in the 12-day 1-ABT assay. Budralazine, dramedilol, RGH-5526, dihydralazine, todralazine, endralazine, and mopidralazine were inactive (pEC50 <5) regardless of assay version. (B) Dose–response chart of poziotinib activity in the 12-day 1-ABT assay, pEC50 against hypnozoites = 6.05. Bars represent SEM.
Figure 5—figure supplement 3.
Figure 5—figure supplement 3.. Epigenetic inhibitor library screen and hits.
(A) Index chart of an epigenetic inhibitor library screened against P. vivax hypnozoites in a v3 (12-day 1-aminobenzotriazole [1-ABT]) assay. Teal circle: library, black square: DMSO, pink triangle: 200 nM nigericin. (B) Structures of epigenetic inhibitor hits which were confirmed to be active against P. vivax hypnozoites in dose–response assays; blue: histone deacetylase inhibitors.
Appendix 1—figure 1.
Appendix 1—figure 1.. Cytosine modification in P. vivax blood stages.
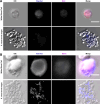
(A) P. vivax blood stages from patient isolates appeared negative when stained with 5mC. A white blood cell positive for 5mC serves as a stain control. (B) P. vivax blood stages from patient isolates appeared negative when stained with 5hmC. A white blood cell positive for 5hmC serves as a stain control. Bars represent 10 µm.

Update of

  • A Drug Repurposing Approach Reveals Targetable Epigenetic Pathways in Plasmodium vivax Hypnozoites.
    Maher SP, Bakowski MA, Vantaux A, Flannery EL, Andolina C, Gupta M, Antonova-Koch Y, Argomaniz M, Cabrera-Mora M, Campo B, Chao AT, Chatterjee AK, Cheng WT, Chuenchob E, Cooper CA, Cottier K, Galinski MR, Harupa-Chung A, Ji H, Joseph SB, Lenz T, Lonardi S, Matheson J, Mikolajczak SA, Moeller T, Orban A, Padín-Irizarry V, Pan K, Péneau J, Prudhomme J, Roesch C, Ruberto AA, Sabnis SS, Saney CL, Sattabongkot J, Sereshki S, Suriyakan S, Ubalee R, Wang Y, Wasisakun P, Yin J, Popovici J, McNamara CW, Joyner CJ, Nosten F, Witkowski B, Le Roch KG, Kyle DE. Maher SP, et al. bioRxiv [Preprint]. 2024 Mar 25:2023.01.31.526483. doi: 10.1101/2023.01.31.526483. bioRxiv. 2024. Update in: Elife. 2025 Sep 30;13:RP98221. doi: 10.7554/eLife.98221. PMID: 36778461 Free PMC article. Updated. Preprint.

References

    1. Adams JH, Mueller I. The biology of Plasmodium vivax. Cold Spring Harbor Perspectives in Medicine. 2017;7:a025585. doi: 10.1101/cshperspect.a025585. - DOI - PMC - PubMed
    1. Adapa SR, Taylor RA, Wang C, Thomson-Luque R, Johnson LR, Jiang RHY. Plasmodium vivax readiness to transmit: implication for malaria eradication. BMC Systems Biology. 2019;13:5. doi: 10.1186/s12918-018-0669-4. - DOI - PMC - PubMed
    1. Ansari HR, Templeton TJ, Subudhi AK, Ramaprasad A, Tang J, Lu F, Naeem R, Hashish Y, Oguike MC, Benavente ED, Clark TG, Sutherland CJ, Barnwell JW, Culleton R, Cao J, Pain A. Genome-scale comparison of expanded gene families in Plasmodium ovale wallikeri and Plasmodium ovale curtisi with Plasmodium malariae and with other Plasmodium species. International Journal for Parasitology. 2016;46:685–696. doi: 10.1016/j.ijpara.2016.05.009. - DOI - PubMed
    1. Antonova-Koch Y, Meister S, Abraham M, Luth MR, Ottilie S, Lukens AK, Sakata-Kato T, Vanaerschot M, Owen E, Jado JC, Maher SP, Calla J, Plouffe D, Zhong Y, Chen K, Chaumeau V, Conway AJ, McNamara CW, Ibanez M, Gagaring K, Serrano FN, Eribez K, Taggard CM, Cheung AL, Lincoln C, Ambachew B, Rouillier M, Siegel D, Nosten F, Kyle DE, Gamo FJ, Zhou Y, Llinás M, Fidock DA, Wirth DF, Burrows J, Campo B, Winzeler EA. Open-source discovery of chemical leads for next-generation chemoprotective antimalarials. Science. 2018;362:eaat9446. doi: 10.1126/science.aat9446. - DOI - PMC - PubMed
    1. Avery VM, Bashyam S, Burrows JN, Duffy S, Papadatos G, Puthukkuti S, Sambandan Y, Singh S, Spangenberg T, Waterson D, Willis P. Screening and hit evaluation of a chemical library against blood-stage Plasmodium falciparum. Malaria Journal. 2014;13:190. doi: 10.1186/1475-2875-13-190. - DOI - PMC - PubMed

MeSH terms

LinkOut - more resources