. 2025 Oct 7;122(40):e2513120122.
doi: 10.1073/pnas.2513120122. Epub 2025 Sep 30.

Biliverdin reductase A is a major determinant of protective NRF2 signaling

Affiliations

Biliverdin reductase A is a major determinant of protective NRF2 signaling

Chirag Vasavda et al. Proc Natl Acad Sci U S A. .

Abstract

Biliverdin reductase A (BVRA), the terminal enzyme in heme catabolism, generates the neuroprotective and lipophilic antioxidant bilirubin. Here, we identify a nonenzymatic role for BVRA in redox regulation. Through phylogenetic, genetic, biochemical, and enzymatic assays, we found that BVRA exerts critical nonenzymatic antioxidant activity. Transcriptomic analyses further revealed that BVRA physically and genetically interacts with nuclear factor erythroid-derived factor-like 2 (NRF2), a major transcriptional regulator of cellular redox signaling. ChIP-seq and RNA-seq analyses reveal that BVRA and NRF2 coordinate the expression of antioxidant genes, many of which are typically dysregulated in neurodegenerative conditions such as Alzheimer's disease. Thus, this noncanonical BVRA-NRF2 axis controls an essential pathway of redox signaling in neuroprotection. Our findings position BVRA as a dual-function integrator of antioxidant defense across both lipophilic and hydrophilic compartments, bridging these two distinct modes of redox protection in the brain.

Keywords: NRF2 signaling; biliverdin reductase A; gene regulation; neuroprotection; oxidative stress.


Conflict of interest statement

Competing interests statement:The authors declare no competing interest.

Figures
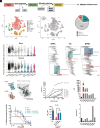
Fig. 1.
Fig. 1.
BVRA exhibits expression profiles and redox homeostatic activity unlinked to heme catabolism. (A) Schematic representation of the heme catabolic pathway. Heme is metabolized by heme oxygenases (HO) to produce biliverdin which BVRA then reduces to bilirubin. (B) T-distributed stochastic neighbor embedding (t-SNE) analysis of single-cell RNA expression in primary neuronal cultures from WT C57BL/6J mice derived from Dugger et al. Each point represents a single cell. (Left) Cells are clustered by gene expression into populations with similar cell type and function. (Right) Expression distribution of Blvra, Hmox2, both individually and together, across cell population clusters. (C) Quantified percentage of total cells expressing Blvra, Hmox2, or a combination of both genes. (D) Scaled Pearson residuals of Blvra and Hmox2 gene expression in different cell populations. A residual >1 indicates a higher observed to expected frequency ratio. Each point represents a single cell. (E) Phylogenetic trees of BVRA, HO, and BVRB, respectively. (F) Protein structures of BVRA (PDB 2H63, Kavanagh et al.) and BVRB (PDB 1HE3, Periera et al.). Structural comparison of the two BVR proteins aligned at the Rossmann fold of the NADPH-binding domain. (G) Activity of WT BVRA and BVRA mutants measured at varying concentrations of NADPH and 10 μM biliverdin. Activity measured by absorbance reading of bilirubin production at 442 nM with Vo calculated according to the method by Michaelis and Menten. n = 3 in triplicate. (H) Quantified Vmax and Km of WT BVRA and BVRA mutants. (I) Viability of WT and Blvra−/− MEFs transfected with empty vector, WT BVRA, and G17A-BVRA after 8 h of exposure to serial dosing of H2O2. Data are normalized to viability of vehicle condition. (J) Quantified LD50s (I) of H2O2 exposure in WT and Blvra−/− MEFS. n = 3 in triplicate.
Fig. 2.
Fig. 2.
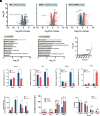
NRF2 activity is disrupted in Blvra−/− neurons and fibroblasts. (A–C) Volcano plot analysis of genes from WT and Blvra−/− primary hippocampal neurons. Each plot displays the fold change of gene expression on a log scale with their corresponding P values plotted on a log scale. Each dot represents a gene of interest. Differences in gene expression in (A) WT and (B) Blvra−/− neurons treated with either vehicle or H2O2 or (C) between WT and Blvra−/− neurons treated with H2O2. (D) Upregulated (Left) and downregulated (Right) molecular pathways in Blvra−/− neurons compared to WT controls following treatment with H2O2. (E) Transcription factors ranked by log-scaled P values. A higher P value indicates transcription factors that are more significantly dysregulated in Blvra−/− compared to WT neurons in the H2O2 condition. (FI) qPCR of NRF2 target genes from WT and Blvra−/− neurons treated with vehicle or 200 μM H2O2 for 6 h. n = 3, SEM, P < 0.01, Student’s t test. (J) Luciferase reporter assays from WT and Blvra−/− MEFs transfected with Gsta4 luciferase reporter construct after exposure to vehicle, 50 μM H2O2, 10 μM SFN, or 25 μM TBHQ for 4 h. n = 4 in triplicate. Student’s t test. (K) Luciferase reporter assays in cell lines harboring a 5xARE reporter transfected with either WT BVRA or G17A-BVRA and after exposure to either vehicle, 200 μM H2O2, 10 μM SFN, or 25 μM TBHQ for 4 h. n = 4 in triplicate. Tukey’s multiple comparison. (L) Viability of WT and Blvra−/− MEFs treated with erastin, for 18 h. n = 7, SEM, P < 0.05, **P < 0.01, ****P < 0.001, Student’s t test.
Fig. 3.
Fig. 3.
BVRA genetically and physically interacts with NRF2. (A) Expected versus observed frequency of pups from the Blvra−/− and Nfe2l2−/− (Nrf2−/−) cross. (B) Number of observed pups of each genotype. n = 114 pups total. (C) GST pulldown with GSH sepharose beads from HEK293 cells cotransfected with GFP-NRF2 and either GST-BVRA or GST-only vector control. (D) Coprecipitation of GFP-NRF2 with GST-BVRA or GST-BVRB. (E) GFP-NRF2 coprecipitation with GST-WT BVRA and GST-G17A-BVRA. Shorter exposure was used for G17A IP lanes, and longer exposure was used for the remaining lanes. (F) Coprecipitation of GST-BVRA and GFP-NRF2 treated with vehicle, 200 μM H2O2, or 100 μM pyrogallol for 4 h. (G) Coprecipitation of GST-BVRA and GFP-NRF2 in the presence of 10 μM biliverdin in HEK293 cells.
Fig. 4.
Fig. 4.
ChIP-seq analysis reveals genes regulated by both BVRA and NRF2. (A) Schematic representation of methods used for genomic analysis. [The data obtained from ChIP-seq were overlaid onto the RNA-seq data from the primary hippocampal neurons in vehicle treated (V) or H2O2-treated conditions (T)]. (B) Global representation of Flag-BVRA and NRF2 peak distribution and Motifs. (C) Venn diagram showing overlap of genes associated with both BVRA and NRF2 peaks. (D) MA plot with normalized readcounts [A, x-axis] vs differentially expressed readcounts between WT and Blvra−/− [M, y-axis]. (E) GSEA of BVRA–NRF2–associated genes from C. (F) Summary of canonical and noncanonical roles of BVRA. BVRA acts on heme-derived biliverdin to produce the antioxidant-cytoprotectant bilirubin, which scavenges superoxide generated from mitochondrial activity and other processes to maintain redox balance. In addition to this role in heme catabolism, BVRA also functions as a serine-threonine and tyrosine kinase that modulates several signaling pathways via NRF2 signaling, independent of its enzymatic roles.

Update of

References

    1. Paul B. D., Pieper A. A., Neuroprotective roles of the biliverdin reductase-A/bilirubin axis in the brain. Biomolecules 14, 15 (2024). - PMC - PubMed
    1. Vasavda C., et al. , Bilirubin links heme metabolism to neuroprotection by scavenging superoxide. Cell Chem. Biol. 26, 1450–1460.e7 (2019). - PMC - PubMed
    1. Vitek L., et al. , Gilbert syndrome and ischemic heart disease: A protective effect of elevated bilirubin levels. Atherosclerosis 160, 449–456 (2002). - PubMed
    1. Woronyczova J., et al. , Serum bilirubin concentrations and the prevalence of Gilbert syndrome in elite athletes. Sports Med. 8, 84 (2022). - PMC - PubMed
    1. Schwertner H. A., Jackson W. G., Tolan G., Association of low serum concentration of bilirubin with increased risk of coronary artery disease. Clin. Chem. 40, 18–23 (1994). - PubMed

LinkOut - more resources