. 2025 Sep 30;16(1):8699.
doi: 10.1038/s41467-025-63726-2.

Protein corona formed on lipid nanoparticles compromises delivery efficiency of mRNA cargo

Affiliations

Protein corona formed on lipid nanoparticles compromises delivery efficiency of mRNA cargo

Elizabeth Voke et al. Nat Commun. .

Abstract

Lipid nanoparticles (LNPs) are the most clinically advanced nonviral RNA-delivery vehicles, though challenges remain in fully understanding how LNPs interact with biological systems. In vivo, proteins form an associated corona on LNPs that redefines their physicochemical properties and influences delivery outcomes. Despite its importance, the LNP protein corona is challenging to study owing to the technical difficulty of selectively recovering soft nanoparticles from biological samples. Herein, we develop a quantitative, label-free mass spectrometry-based proteomics approach to characterize the protein corona on LNPs. Critically, this protein corona isolation workflow avoids artifacts introduced by the presence of endogenous nanoparticles in human biofluids. We apply continuous density gradient ultracentrifugation for protein-LNP complex isolation, with mass spectrometry for protein identification normalized to protein composition in the biofluid alone. With this approach, we quantify proteins consistently enriched in the LNP corona including vitronectin, C-reactive protein, and alpha-2-macroglobulin. We explore the impact of these corona proteins on cell uptake and mRNA expression in HepG2 human liver cells, and find that, surprisingly, increased levels of cell uptake do not correlate with increased mRNA expression in part due to protein corona-induced lysosomal trafficking of LNPs. Our results underscore the need to consider the protein corona in the design of LNP-based therapeutics.


Conflict of interest statement

Competing interests: K.A.W. is an inventor on US patents 9,227,917 (2016) and 9,439,968 (2016) related to the LNPs described here and is a consultant for several companies translating nonviral RNA delivery systems. The remaining authors declare no competing interests.

Figures

Fig. 1
Fig. 1. Challenges of existing methods for LNP corona characterization.
a The separation process to isolate protein-LNP complexes from plasma is challenging because of the variety of endogenous particles (exosomes, lipoproteins, etc.) in plasma with similar physicochemical properties to LNPs with associated protein coronas, arising from their similar composition of lipid and protein species. Illustrations demonstrating b why ultracentrifugation (that pellets all particles) and c discrete sucrose gradients (that isolate LNPs at the interface of two different density solutions) fail to effectively separate LNPs from biofluid-derived particles. Created in BioRender. Voke, E. (2025) https://BioRender.com/58u4s4t.
Fig. 2
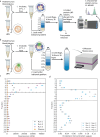
Fig. 2. Proteomics workflow for label-free, quantitative protein corona profiling on LNPs.
a LNPs were incubated with pooled human blood plasma for 1 hour at 37 °C then mixed with the low osmolarity density gradient medium, iodixanol, to a final concentration of 30% iodixanol before being loaded under five distinct layers of iodixanol (25%, 20%, 15%, 10%, and 5%) and centrifuged for 16 hours at 36,000 rpm. 0.5-mL fractions were collected from the top to the bottom and selected fractions were processed for LC-MS/MS characterization. Created in BioRender. Voke, E. (2025) https://BioRender.com/58u4s4t. b LNPs were tagged with lissamine rhodamine, incubated with blood plasma, and loaded under an iodixanol gradient with the same isolation workflow conditions. Created in BioRender. Voke, E. (2025) https://BioRender.com/58u4s4t. c Fluorescence measurements of fluorescently tagged LNPs after the DGC isolation workflow reveal that 0.5-mL fractions 2–6 (dotted lines) in the density gradient have the maximum number of LNPs. Excitation/emission wavelengths of 560/580 nm were used to detect lissamine rhodamine-tagged LNPs. N = 4 technical replicates, n = 3 biological replicates. Data are presented as mean values with standard deviation. d Average total cholesterol quantification of plasma-alone gradient fractions collected after DGC isolation workflow show that lipoproteins within plasma are present primarily among fractions 5–10 (dotted lines). N = 2 technical replicates, n = 2 biological replicates.
Fig. 3
Fig. 3. Proteomic analysis of the LNP protein corona.
a Normalization across density gradient fractions enables proteomic analysis that accounts for native lipoproteins found in plasma. Created in BioRender. Voke, E. (2025) https://BioRender.com/58u4s4t. b Violin plot of peptide coefficient of variation (CV) analysis shows low variation in peptide quantification during LC-MS/MS (n = 3 technical replicates). The overlaid box-and-whisker plot is defined as follows: the white dot indicates the median; the box spans the interquartile range (IQR), from the 25th to 75th percentiles; and the whiskers extend from the IQR to the minimum and maximum values within 1.5×IQR. c Log2 fold change of LNP-corona proteins discovered via LC-MS/MS vs. negative log10 of the q value, showing nonsignificant proteins in gray, significantly enriched corona proteins in red, and significantly depleted corona proteins in blue (n = 3 technical replicates). d Gene Ontology analysis of enriched corona proteins and e KEGG pathway analysis of enriched corona proteins are shown for p values < 0.05. f Enriched proteins mapped to lipoprotein components with identified proteins starred. Created in BioRender. Voke, E. (2025) https://BioRender.com/58u4s4t. g Log2 fold change of LNP-corona proteins, with bubble size denoting femtomolar (fmol) abundance. Please see the Methods section for full details on analysis and significance.
Fig. 4
Fig. 4. In vitro mRNA expression with delivery by protein-LNP complexes.
a LNPs loaded with mRNA encoding luciferase were incubated with selected high-binding corona proteins (0.05 ng mRNA: 1 ng protein) prior to introduction to HepG2 cells seeded at 4.7 × 104 cells per cm2 (100 ng mRNA per well). The luminescence was measured as a proxy for mRNA expression to understand the effect of proteins on LNP delivery efficiency. Luminescence was normalized to the average of each no-corona LNP biological control for all in vitro studies. Created in BioRender. Voke, E. (2025) https://BioRender.com/58u4s4t. b Resulting luminescence of pre-incubations of individual proteins with LNPs showed no significant change in luminescence (mRNA expression) for ApoE, A2M, or a mixture of the proteins, while showing a significant decrease for VTN or CR, each relative to the no-corona LNP control. c Dose–response of protein concentrations for VTN incubated LNPs showed a significant decrease in mRNA expression compared to the no-corona LNP control. d Cell viability showed no statistical difference for protein incubations. N = 4 technical replicates, n = 3 biological replicates. Data points shown are biological replicates. All data are presented as mean values with standard deviation. Statistical analysis was performed by repeated measures one-way ANOVA test with Geisser–Greenhouse correction, followed by Dunnett’s multiple comparisons test where * and ** represent p ≤ 0.05 and p ≤ 0.01, respectively.
Fig. 5
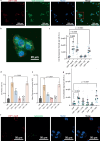
Fig. 5. Uptake and lysosomal co-localization of protein-LNP complexes in HepG2 cells.
a HepG2 cells internalizing LNPs loaded with Cy5-mRNA pre-incubated with high-binding corona proteins were visualized by confocal microscopy. Representative image of LNP + VTN incubations showing LNPs (Cy5; red), cell membrane (CellBrite membrane dye; green), and nuclei (Hoechst; blue). b Inset showing a magnified view of the region outlined by the red box in (a). c Quantification of Cy5 (LNP) signal per cell demonstrates differences in cell Cy5-mRNA uptake between select corona protein incubations (n = 4 technical replicates, n = 3 biological replicates). Each dot represents an individual field-of-view-level measurement, color-coded by biological replicate; larger, black-outlined dots indicate the mean value for each biological replicate. Statistical analysis was performed by a nested one-way ANOVA test followed by Dunnett’s multiple comparisons test. d, e Cy5 signal from HepG2 cells internalizing LNPs loaded with Cy5-mRNA pre-incubated with high-binding corona proteins was also quantified by flow cytometry. d Percentage of Cy5-positive cells and e mean fluorescence intensity show uptake trends consistent with microscopy. Data points shown are biological replicates (n = 3 technical replicates, n = 3 biological replicates). Error bars denote standard deviation. Statistical analysis was performed by repeated measures one-way ANOVA test with Geisser-Greenhouse correction, followed by Dunnett’s multiple comparisons test. To compare endosome entrapment for select protein incubations, co-localization of the Cy5 signal (LNP) and fluorescently labeled lysosomes (green) was analyzed. Representative image of LNP + ApoE incubation shows f LNPs (red), lysosomes (green) and nuclei (blue) fluorescently labeled. g Quantification of overlapping Cy5 (LNP) and lysosome signal per cell (n = 4 technical replicates, n = 4 biological replicates). Each dot represents an individual field-of-view-level measurement, color-coded by biological replicate; larger, black-outlined dots indicate the mean value for each biological replicate. Statistical analysis was performed by a nested one-way ANOVA test followed by Dunnett’s multiple comparisons test. For all statistical analyses performed, *, **, and *** represent p ≤ 0.05, 0.01, and 0.001, respectively. All image thresholding was applied uniformly across samples, and image channels were adjusted solely for visualization purposes.
Fig. 6
Fig. 6. Mismatch between mRNA expression and cell uptake.
a Differences in cell uptake, lysosome co-localization, and mRNA expression for protein-LNP complexes (arrows indicate increase or decrease and bars indicate no change). Created in BioRender. Voke, E. (2025) https://BioRender.com/58u4s4t. b Proteins influence LNP uptake into the cell through non-specific (1a) and/or receptor-mediated uptake (1b). These protein-LNP complexes enter (2) early endosomes, where the lower pH (pH ~5) environment ionizes the LNP and may impact the protein charge depending on its isoelectric point. Next, the mRNA must escape the endosome for protein expression (3). These proteins likely impact LNP endosomal escape, leading to different mRNA expression outcomes. Created in BioRender. Voke, E. (2025) https://BioRender.com/58u4s4t.

Update of

References

    1. Chaudhary, N., Weissman, D. & Whitehead, K. A. mRNA vaccines for infectious diseases: principles, delivery and clinical translation. Nat. Rev. Drug Discov.20, 817–838 (2021). - PMC - PubMed
    1. Gilleron, J. et al. Image-based analysis of lipid nanoparticle–mediated siRNA delivery, intracellular trafficking and endosomal escape. Nat. Biotechnol.31, 638–646 (2013). - PubMed
    1. Hajj, K. A. & Whitehead, K. A. Tools for translation: non-viral materials for therapeutic mRNA delivery. Nat. Rev. Mater.2, 1–17 (2017).
    1. Hou, X., Zaks, T., Langer, R. & Dong, Y. Lipid nanoparticles for mRNA delivery. Nat. Rev. Mater.6, 1078–1094 (2021). - PMC - PubMed
    1. Kowalski, P. S., Rudra, A., Miao, L. & Anderson, D. G. Delivering the messenger: advances in technologies for therapeutic mRNA delivery. Mol. Ther.27, 710–728 (2019). - PMC - PubMed

LinkOut - more resources