. 2025 Sep 30;16(1):8673.
doi: 10.1038/s41467-025-63696-5.

Tumor immune dynamics and long-term clinical outcome of stage IIIA NSCLC patients treated with neoadjuvant chemoimmunotherapy

Affiliations

Tumor immune dynamics and long-term clinical outcome of stage IIIA NSCLC patients treated with neoadjuvant chemoimmunotherapy

Dominic Schmid et al. Nat Commun. .

Abstract

Neoadjuvant chemoimmunotherapy offers promise to improve outcomes for patients with resectable non-small cell lung cancer (NSCLC). Yet not all patients derive treatment benefits, and reliable biomarkers of response are still lacking. We here assess the long-term clinical outcome of neoadjuvant chemotherapy and perioperative anti-PD-L1 inhibition in resectable stage IIIA NSCLC in the SAKK 16/14 trial and provide a comprehensive characterization of anti-tumor immune responses for biomarker-based treatment personalization. We report secondary outcomes of median event-free survival (EFS) of 4.0 years and median overall survival not being reached after a median follow-up of 5.4 years. Computer-aided spatial image analysis emphasizes the importance of CD8+ T cell positioning in tumors, and larger tertiary lymphoid structures in pre-treatment biopsies correlate with improved EFS. Genomic techniques reveal the association of intratumoral TCR diversity with response. Finally, circulating proliferating CD39+ PD-1+ CD8+ T cells and elevated levels of CCL15 post-treatment are seen in patients with sustained therapeutic benefit. NCT02572843.


Conflict of interest statement

Competing interests: D.S., B.S., MaMa, P.H., O.R.O., S.H., G.T., A.B., C.W., M.B., M.G. and I.A. do not report competing interests. M.T.: Numab Therapeutics (employment and equity or stocks). K.L.: LNS Laboratoire national de santé (employment). P.J.: Thermo Fisher Scientific (employment). S.S.P.: Novartis (honoraria), Diaceutics Ireland Limited, Merck (Schweiz) AG, AstraZeneca AG (consulting or advisory role). M.N.: AstraZeneca PLC (employment and equity or stocks). M.P.: Janssen-Cilag (honoraria), AbbVie, AstraZeneca, Boehringer Ingelheim, Bristol Myers Squibb, Eisai Europe, MSD Oncology, Novartis, Pfizer/EMD Serono, Roche, Takeda, Merck Serono (consulting or advisory role), Takeda (expert testimony), Vifor Pharma, Bristol Myers Squibb, Boehringer Ingelheim, AstraZeneca (travel, accommodation, expenses). M.F.: BMS, AstraZeneca, MSD, Takeda, Roche, Lilly (consulting or advisory role), Pfizer (speakers’ bureau), BMS, AstraZeneca (research funding) LAM: Takeda, Roche, AstraZeneca, Bristol Myers Squibb, Merck Sharp & Dohme, Pfizer (consulting or advisory role), Takeda, Bristol Myers Squibb, Merck, Roche, AstraZeneca (travel, accommodation, expenses). C.B.: AstraZeneca, Pfizer, Roche, Takeda, Janssen-Cilag, Boehringer Ingelheim (consulting or advisory role), AstraZeneca, Takeda (travel, accommodation, expenses). S.P.: Roche, Bristol Myers Squibb, Novartis, Pfizer, MSD, AstraZeneca, Takeda, Illumina, Medscape (honoraria), Roche/Genentech, Novartis, Bristol Myers Squibb, Pfizer, MSD, Amgen, AstraZeneca, Janssen, Regeneron, Merck Serono, Boehringer Ingelheim, Takeda, Lilly, AbbVie, Bayer, Biocartis, Debiopharm Group, Illumina, PharmaMar, Sanofi, Seattle Genetics, Blueprint Medicines, Daiichi Sankyo, Incyte, Bioinvent, Clovis Oncology, Vaccibody, Phosplatin Therapeutics (consulting or advisory role), Roche, BMS, MSD, Amgen, Lilly, AstraZeneca, Pfizer, Illumina, Merck Serono, Novartis, Biodesix, Boehringer Ingelheim, Iovance Biotherapeutics, Phosplatin Therapeutics (research funding), Roche, Bristol Myers Squibb, MSD, Sanofi, Incyte (travel, accommodation, expenses). MiMa: Roche, AstraZeneca, Takeda, BMS, MSD Oncology (consulting or advisory role), Pfizer, Roche, Takeda (travel, accommodation, expenses). A.F.O.: Tolremo (consulting or advisory role), argenx (research funding) W.D.J.: Roche, Takeda, MSD, Novartis (consulting or advisory role). N.M.: MaxVAX SA (stock or equity, research funding). P.F.: Pfizer, Takeda, Roche, Boehringer Ingelheim, AstraZeneca, Novartis, Bayer (consulting or advisory role). P.B.: MSD, Bayer (consulting or advisory role), Janssen (travel, accommodation, expenses). S.R.: Bristol Myers Squibb, AstraZeneca, Boehringer Ingelheim, Eisai, Roche, Novartis, Merck Serono, MSD Oncology, Pfizer, Takeda, AbbVie (consulting or advisory role), Boehringer Ingelheim, AstraZeneca, Bristol Myers Squibb, Eisai, Merck Serono, AbbVie (research funding), Roche, AstraZeneca, Bristol Myers Squibb (expert testimony), Roche Pharma AG, Lilly, Bristol Myers Squibb, AstraZeneca, Merck Sharp & Dohme, Amgen (travel, accommodation, expenses). V.H.K.: Sharing Progress in Cancer Care, Indica Labs (invited speaker), Takeda (consulting or advisory role), Roche, IAG (research funding), patent applications on the assessment of cancer immunotherapy biomarkers by digital pathology and for the prediction of cancer recurrence risk and prediction of treatment efficacy using deep learning, unrelated to the current study. A.Z.: Roche, NBE Therapeutics, Engimmune (consulting or advisory role), Roche, Bright Peak Therapeutics, T3 Pharma (research funding).

Figures

Fig. 1
Fig. 1. Five-year clinical outcomes of the SAKK 16/14 trial.
a Flow chart of the SAKK 16/14 trial and biospecimen collection. NSCLC, non-small cell lung cancer; TP, timepoint. b Kaplan-Meier curves of overall and c event-free survival at data cutoff on September 2, 2024. Median follow-up time was 5.4 years. Source data are provided as a Source Data file.
Fig. 2
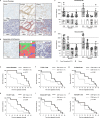
Fig. 2. Spatial distribution of intratumoral immune populations.
a, b Illustration of analysis pipeline performed on a total of n = 47 tumor sections (initial biopsies and tumor resections). a Micrograph of three isolated, representative tumor regions illustrating the desert, excluded and inflamed immune microenvironments (generic examples). Overall tumor annotation is derived from a characterization of the entire tumor. Top row shows CD8 immunohistochemistry (IHC) image, bottom row shows mark-up with CD8+ T cells depicted in red and tumor cells in blue. Indents show scales. b Micrograph of representative tumor. Left, IHC image for cell annotation; middle, machine-learning-based image segmentation showing tumor compartment (TC) in red, stroma in blue and desmoplastic stroma in green; right, detection of cell populations in different tumor segments. Idents show scales. Densities of cells expressing CD3, CD8, FoxP3, and CD20, respectively, in the TC and the stroma of initial biopsies (IB) acquired at TP1 (c) and resection specimens (RES) with residual tumor acquired at TP3 (d). Dashed line: highest mean CD3+ cell density. Dotted line: highest mean CD8+ T cell density detected. Data is shown separately for immune excluded and inflamed tumors (n = 15/6 initial biopsies (c) and n = 15/11 resections (d), distinguished as described in Methods. Each specimen is represented by two dots, one per compartment: stroma (filled) and tumor compartment (empty). Bars show means +SEM for each compartment: stroma (gray) and tumor compartment (white). Statistical testing was performed with two-way ANOVA and Tukey’s multiple comparison test. e–j Kaplan-Meier event-free survival curves of patients in the SAKK 16/14 trial according to pre-treatment immune phenotype and immune cell densities in initial biopsies. Statistical significance was assessed with the log-rank Mantel-Cox test. Source data are provided as a Source Data file.
Fig. 3
Fig. 3. TLS characterization via digital pathology.
a Micrograph of representative tumor section illustrating detection of tertiary lymphoid structures (TLS), performed in n = 27 tumor sections (initial biopsies and tumor resections). Left, CD20 immunohistochemistry (IHC) image; middle, machine-learning-based tissue segmentation; right, machine-learning-based identification of TLS and area quantification. Indents show scales. b Kaplan-Meier event-free survival (EFS) curves of patients in the SAKK 16/14 trial according to average TLS size above or below the median in initial biopsies (n = 14). Statistical significance was assessed with the log-rank Mantel-Cox test. c Analysis of CD8+ T cell density versus TLS size in initial biopsies (n = 14) with their TIME classified as excluded (n = 10) or inflamed (n = 4). d Modified swimmer plot showing EFS of patients with matched initial biopsies (TP1) and resections (TP3) (n = 13). Left column shows density of CD8+ T cells in the tumor compartment, right column shows average TLS size. Colors on the left and right denote the immune phenotype in biopsies (left) and resection (right). In patients with complete histological tumor regression, the data indicate the immune cell counts in the tumor bed (scar) area (shown in yellow). IB initial biopsy (TP1); RES, resection (TP3); TC tumor compartment; pCR pathological complete response. Source data are provided as a Source Data file.
Fig. 4
Fig. 4. T cell receptor sequencing in post-treatment PBMCs and tumor tissue.
a–c Differences in post-treatment (TP3) TCR repertoire metrics in tumor resection samples comparing patients achieving and not achieving a 12-months event-free survival (EFS, n = 36/12). d–f Differences in TCR repertoire in PBMCs of patients achieving and not achieving a 12-months EFS, n = 38/10 (TP1), 31/10 (TP2) and 39/12 (TP3). The analysis was conducted on all sequencing reads (a–c) and on 250’000 randomly down-sampled sequencing reads (d–f), see Methods for details. Clonal richness (number of clones (a, d)), evenness (b, e) and Hill-Simpson diversity (c, f) are shown. Statistical testing was performed with two-sided Mann Whitney test (a–c) and mixed-effects model (restricted maximum likelihood, REML) with Tukey’s multiple comparisons test (d–f). p values below 0.2 are shown in d–f. Source data are provided as a Source Data file.
Fig. 5
Fig. 5. CyTOF and spectral flow cytometry of PBMCs pre- and post-neoadjuvant chemoimmunotherapy.
a Uniform Manifold Approximation and Projection (UMAP) of mass cytometry data of PBMCs post-neoadjuvant chemoimmunotherapy (TP3) in selected patients (n = 50,000 randomly selected cells). Responders comprise n = 8 pre-selected SAKK 16/14 trial participants who achieved MPR and an EFS of at least 12 months. Non-responders comprise n = 7 pre-selected patients who neither achieved MPR nor an EFS of 12 months. Each dot represents a single cell, color-coded by cell cluster. b Volcano plot representing the false discovery rate (−log10FDR) as a function of fold change (FC, log2FC) of major immune cell lineages identified in mass cytometry as calculated by edgeR. Each dot denotes a lineage. c Proportion of FlowSOM clusters (rows) within all cells of individual pre-selected patients (columns) post-neoadjuvant chemoimmunotherapy (TP3, TP1 see Fig. S6e). Clusters were arranged by their FDRs (right bar graph). d Frequency of the CD8 T PD-1+ cluster within CD8+ T cells of responders (n = 8) and non-responders (n = 7) at TP1 and TP3 in peripheral blood. e CD4 T CD57+ cluster within CD4+ T helper (Th) cells of responders (n = 8) and non-responders (n = 7) at TP1 and TP3 in peripheral blood. f Median TIM-3 dual counts in cDC cluster of responders (n = 8) and non-responders (n = 7) at TP1 and TP3 in peripheral blood. g Percentage of proliferating (Ki-67+) cells within CD39+ PD-1+ CD8+ T cells in peripheral blood of patients with event-free survival (EFS)≥12 months and EFS<12 months as assessed via spectral flow cytometry, n = 36/6 (TP1), 40/10 (TP2), 28/10 (TP3) and 32/6 (TP4). h TIM-3 geometric mean fluorescence intensity (gMFI) in lineage (Lin, CD3 CD19 CD56 CD14)- CD11c+ HLA-DRhigh cDC in patients with EFS≥12 months and EFS<12 months, n = 37/8 (TP1), 42/12 (TP2), 32/10 (TP3) and 33/6 (TP4). Bars represent means +SEM (d–h). Statistical testing with two-way ANOVA and uncorrected Fisher’s least significant difference (LSD) test (d–f) or a mixed-effects model (restricted maximum likelihood, REML) with Tukey’s multiple comparisons test (g, h). p values below 0.1 are shown. Source data are provided as a Source Data file.
Fig. 6
Fig. 6. Association of cytokine and chemokine patterns with response.
a Multidimensional scaling (MDS) analysis of global serum cytokine and chemokine levels of participants in the SAKK 16/14 trial, color-coded by event-free survival (EFS) and shape coded by timepoint: EFS<12 months, n = 12 (TP1/TP3); EFS≥12 months, n = 42 (TP1), 36 (TP3). b Post-treatment (TP3) serum concentrations of ten cytokines (TP1 in Fig. S9c), n = 36 (EFS≥12 months) and 12 (EFS<12 months). c Representative flow cytometry plots of CCR1 and Ki67 expression within CD39+ PD-1+ CD8+ T cells in peripheral blood from two elite responders exhibiting elevated CCL15 serum levels. d Percentage of proliferating (Ki-67+) CCR1-expressing cells among CD39+ PD-1+ CD8+ T cells comparing patients with EFS≥12 months and high (n = 2) or low (n = 4) CCL15 serum, and patients with EFS<12 months (n = 4). Bars represent means +SEM (b, d). Statistical testing with two-sided unpaired t test, p values below 0.1 are shown (b). Source data are provided as a Source Data file.

References

    1. Siegel, R. L., Miller, K. D. & Jemal, A. Cancer statistics, 2020. CA Cancer J. Clin.70, 7–30 (2020). - PubMed
    1. Goldstraw, P. et al. The IASLC Lung Cancer Staging Project: proposals for revision of the TNM stage groupings in the forthcoming (eighth) edition of the TNM classification for lung cancer. J. Thorac. Oncol.11, 39–51 (2016). - PubMed
    1. Aguado, C. et al. Neoadjuvant treatment in non-small cell lung cancer: new perspectives with the incorporation of immunotherapy. World J. Clin. Oncol.13, 314 (2022). - PMC - PubMed
    1. Pless, M. et al. Induction chemoradiation in stage IIIA/N2 non-small-cell lung cancer: a phase 3 randomised trial. Lancet386, 1049–1056 (2015). - PubMed
    1. Betticher, D. C. et al. Mediastinal lymph node clearance after docetaxel-cisplatin neoadjuvant chemotherapy is prognostic of survival in patients with stage IIIA pN2 non-small-cell lung cancer: a multicenter phase II trial. J. Clin. Oncol.21, 1752–1759 (2003). - PubMed

MeSH terms

Associated data