. 2025 Sep 30;8(1):1385.
doi: 10.1038/s42003-025-08732-2.

The critical human pathogen Acinetobacter baumannii exhibits light-regulated circadian rhythms

Affiliations

The critical human pathogen Acinetobacter baumannii exhibits light-regulated circadian rhythms

Valentín Permingeat et al. Commun Biol. .

Abstract

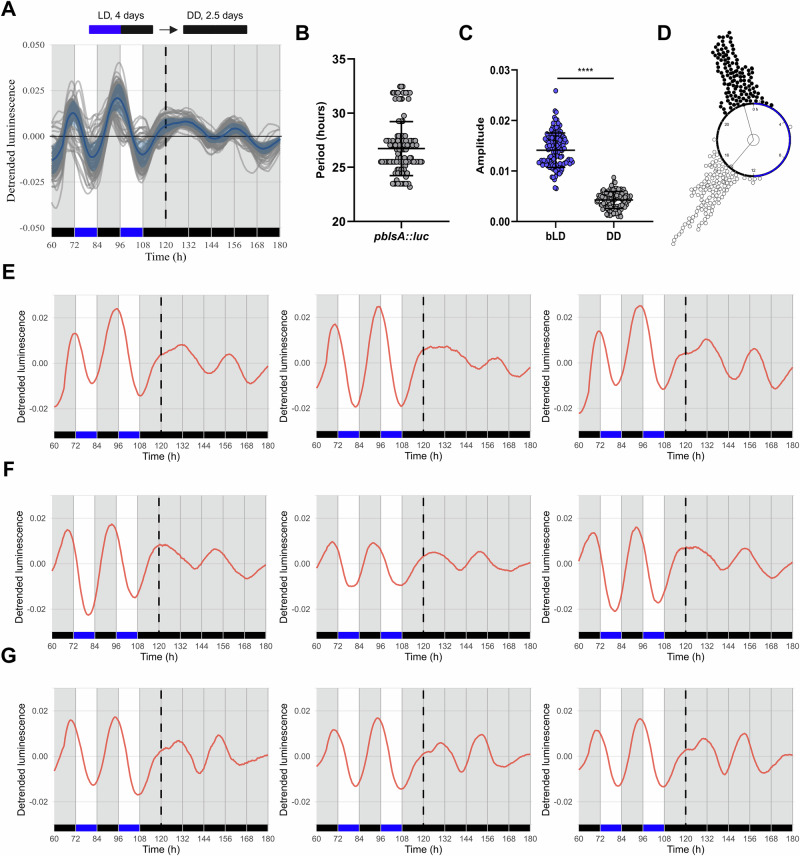
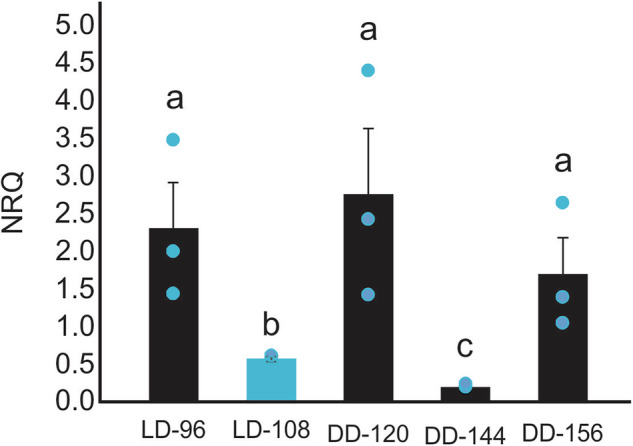
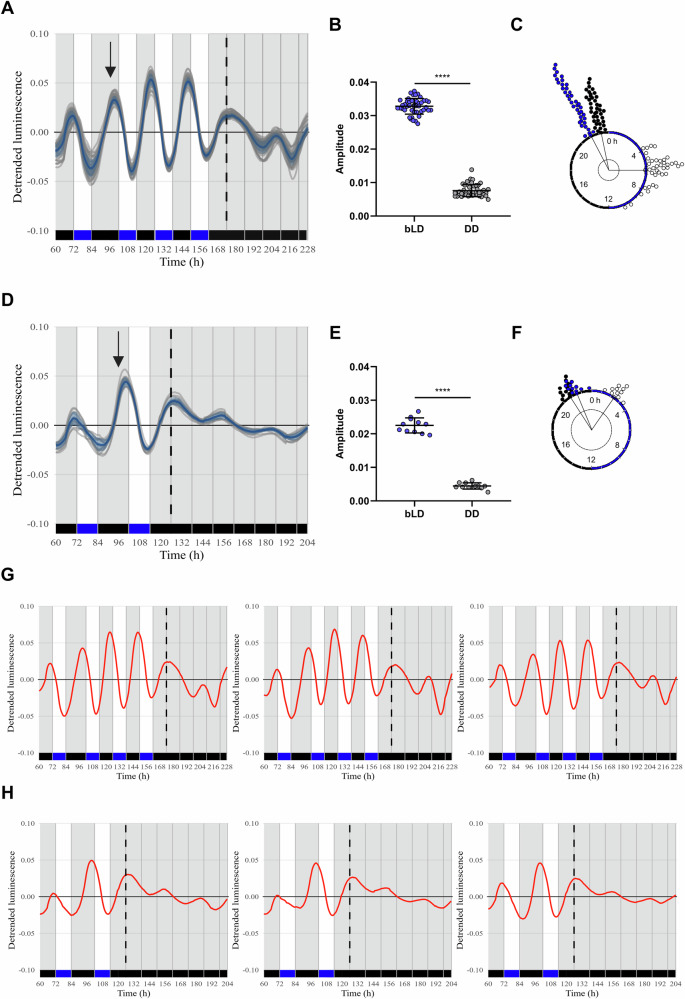
Acinetobacter baumannii is recognized as the paradigm of multidrug-resistant superbug, topping the WHO priority list of critical human pathogens. Interestingly, it senses and responds to blue light, which modulates global aspects of its physiology, including pathogenicity. We hypothesized that light could serve as a signal to synchronize the bacterial physiology to the host's behavior and/or to the environment. At environmental temperatures, light regulation is mainly governed by the photoreceptor BlsA. In this work, we identified the existence of daily rhythms in blsA promoter activity displaying a robust response to light, as well as endogenous circadian rhythms in A. baumannii. In fact, we show that blsA promoter activity can be synchronized to 24-hour blue light-dark cycles, which immediately resynchronizes after a phase shift. Upon release to constant darkness, bacterial populations present free-running oscillations with a period close to 24 hours. Furthermore, our data indicate that BlsA is involved in synchronization to light-dark cycles. In fact, under constant darkness without previous entrainment, A. baumannii is rhythmic, but acrophases are not clusterized, behaving as the blsA mutant under light-dark cycles. Our work contributes to the developing field of circadian clocks in bacterial pathogens, which could impact in the microorganisms' lifestyle and pathogenicity.


Conflict of interest statement

Competing interests: The authors declare no competing interests.

Figures

Fig. 1
Fig. 1. blsA promoter–driven luminescence is rhythmic under entrained and FR conditions.
A Luminescence reporter activity of A. baumannii V15 pLPV1Z-pblsA::luc clone 1. The cultures were incubated in bLD cycles for 4 days and then released to DD. The graph includes all traces of three independent experiments, n = 141. Black/blue bars indicate dark/light periods, respectively. Luminescence signals are shown as mean ± SD in blue (line and shadow, respectively), and the individual wells are represented in grey lines. B Average endogenous period of rhythmic populations of A. baumannii V15 pLPV1Z-pblsA::luc clone 1 (26 ± 2.4 h, n = 124). Data are shown as mean ± SD. C Average amplitude of the luminescence rhythm of rhythmic populations (n = 124) of A. baumannii V15 pLPV1Z-pblsA::luc clone 1. Data are shown as mean ± SD. P-value was calculated using Wilcoxon signed-rank test (****p < 0.0001). D Rayleigh plots showing the phase of the bioluminescent peak under cyclic conditions (bLD, black dots) and the bioluminescent peak of the first day of release to FR (DD, white dots) for the rhythmic population (bLD: ZT22.9 ± 0.8 h, R = 0.98 and DD: CT14.6 ± 1.5 h, R = 0.92; n = 124). Lines represent the average peak phase of pLPV1Z-pblsA::luc activity (mean vectors for the circular distributions) of each group. The length of the vector represents the strength of the phase clustering while the angle of the vector represents the mean phase. Individual data points are plotted outside the circle. The central circle represents the threshold for p = 0.05. EG Individual luminescence plots for the rhythmic populations of A. baumannii V15 pLPV1Z-pblsA::luc clone 1 for biological replica 1, 2 and 3, respectively. Bacteria were grown at a constant temperature of 23 °C. BD analysis included three biological replicates. n = total number of samples; 1 sample = 1 well of a 96-well plate. n rhythmic = number of samples exhibiting circadian rhythmicity under free-running conditions (see Methods for definition).
Fig. 2
Fig. 2. Oscillations in blsA transcript abundance levels.
blsA transcript levels were estimated by RT-qPCR in A. baumannii V15 wild-type cultured under 12bL:12D photoperiod cycles, and then released to constant darkness at 23 °C. The data shown are the mean ± SD of normalized relative quantities (NRQ) in three biological replicates measured in samples prepared from bacteria grown in LB broth. Significant differences determined by ANOVA followed by Tukey’s multiple comparison test (p < 0.05) are indicated by different letters. Gray and light blue colors correspond to dark and blue light incubations, respectively.
Fig. 3
Fig. 3. Luminescence rhythms respond to a change in the photic periodic conditions.
A Average A. baumannii V15 pLPV1Z-pblsA::luc clone 1 population luminescence rhythms after a 6-h phase shift in the 3rd LD day before constant darkness. The arrow indicates the time of the phase shift. The graph includes all traces of one independent experiment, n = 44. Black/blue bars indicate dark/light periods. Luminescence signals are shown as mean ± SD in blue (line and shadow, respectively), and the individual wells are represented in grey lines. B Average amplitude of the luminescence rhythm of rhythmic populations (n = 38). Data are shown as mean ± SD. Two-sample paired t-test, ****p < 0.0001. C Rayleigh plots showing the phase of the bioluminescent peak under cyclic conditions (bLD 1, black dots: 23.2 ± 0.2 h, R = 0.99; bLD 2, blue dots: 22 ± 0.1 h, R = 0.99; n = 38) and the bioluminescent peak on the first day of release to FR (DD, white dots: 5.9 ± 1.4 h, R = 0.93; n = 38) for the rhythmic population. Rayleigh test, P < 0.001. DF Similar experiment as in (A-C) with the modification that the 6-h phase shift was applied at the last LD day. D The graph includes all traces of one independent experiment, which were all rhythmic, n = 11. The arrow indicates the time of the phase shift. Black/blue bars indicate dark/light periods. Luminescence signals are shown as mean ± SD in blue (line and shadow, respectively), and the individual wells are represented in grey lines. E Average amplitude of the luminescence rhythm of rhythmic populations (n = 11). Data are shown as mean ± SD. Two-sample paired t-test, ****p < 0.0001. F Rayleigh plots showing the phase of the bioluminescent peak under cyclic conditions (bLD 1, black dots: 21.8 ± 0.4 h, R = 0.99; bLD 2, blue dots: 22.5 ± 0.5 h, R = 0.99; n = 11) and the bioluminescent peak on the first day of release to FR (DD, white dots: 2.3 ± 0.5 h, R = 0.99; n = 11) for the rhythmic population. Rayleigh test, P < 0.001. Bacteria were grown at a constant temperature of 23 °C. G, H Individual luminescence plots for the rhythmic populations of A. baumannii V15 pLPV1Z-pblsA::luc clone 1 from the two resynchronization experiments, respectively. Bacteria were grown at a constant temperature of 23 °C. n = total number of samples; 1 sample = 1 well of a 96-well plate. n rhythmic = number of samples exhibiting circadian rhythmicity under free-running conditions (see Methods for definition).
Fig. 4
Fig. 4. Blue light synchronization of bioluminescent rhythms requires the BlsA photoreceptor.
A Reporter activity of A. baumannii 17978 pLPV1Z-pblsA::luc clon B populations. The graphs shows all traces of two independent experiments (A. baumannii 17978 pLPV1Z-pblsA::luc clone B, n = 59; 17978 ΔblsA pLPV1Z-pblsA::luc clone B, n = 60). The cultures were incubated in bLD cycles for 4 days and then released to DD. Black/blue bars indicate dark/light periods. Luminescence signals are shown as mean ± SD in blue (line and shadow, respectively), and the individual wells are represented in grey lines. B Average amplitude of the luminescence rhythm of rhythmic populations of A. baumannii 17978 pLPV1Z-pblsA::luc clone B (n = 25) and 17978 ΔblsA pLPV1Z-pblsA::luc (n = 16). Data are shown as mean ± SD. Two-way ANOVA followed by Tukey’s multiple comparisons test. ****p < 0.0001; ns non-significant. C Rayleigh plots showing the phase of the bioluminescent peak under cyclic conditions (bLD, black dots) and the bioluminescent peak on the first day of release to FR (DD, white dots) for the rhythmic population: A. baumannii 17978 pLPV1Z-pblsA::luc clone B (bLD: ZT21.6 ± 0.8 h, R = 0.97 and DD: CT19.3 ± 2.9 h, R = 0.69; n = 25) and 17978 ΔblsA pLPV1Z-pblsA::luc (bLD: ZT22.4 ± 2 h, R = 0.84 and DD: CT16.8 ± 3.9 h, R = 0.48; n = 16). Lines represent the average peak phase of pLPV1Z-pblsA::luc activity (mean vectors for the circular distributions) of each group. The length of the vector represents the strength of the phase clustering, while the angle of the vector represents the mean phase. Individual data points are plotted outside the circle. The central circle represents the threshold for p = 0.05. D Average endogenous period of rhythmic populations of A. baumannii 17978 pLPV1Z-pblsA::luc clone B (24.3 ± 1.4 h, n = 25) and 17978 ΔblsA pLPV1Z-pblsA::luc (24.02 ± 1.6 h, n = 16). Data are shown as mean ± SD. Wilcoxon rank sum test, ns non-significant. E, F Individual luminescence plots for the rhythmic populations of A. baumannii 17978 pLPV1Z-pblsA::luc clone B (E) and 17978 ΔblsA pLPV1Z-pblsA::luc (F). Bacteria were grown at a constant temperature of 23 °C.
Fig. 5
Fig. 5. blsA promoter–driven luminescence under constant darkness conditions.
Luminescence reporter activity of A. baumannii V15 pLPV1Z-pblsA::luc clone 1 (AD) and 17978 pLPV1Z-pblsA::luc clon B (E–H) populations under DD for 7.5 days. The graph in A shows all traces of A. baumannii V15 pLPV1Z-pblsA::luc clone 1, n = 47, while only rhythmic samples are shown in (B), n = 24. Baseline-detrended, normalized luminescence is shown. Average endogenous period (FRP) of rhythmic populations of A. baumannii V15 pblsA::luc clone 1 (23.9 ± 4.5 h, n = 24), and the time window for period calculation is indicated in the top right of panel (B). A representative experiment from two biological replicates is shown. Individual wells are represented in colored lines. C Rayleigh plots showing the phase of the bioluminescent peak under constant darkness DD conditions for the rhythmic population (DD, black dots: 21.9 ± 4.9 h, n = 24; R = 0.1, for the rhythmic population). Lines represent the average peak phase of pLPV1Z-pblsA::luc activity (mean vectors for the circular distributions) of each group. The length of the vector represents the strength of the phase clustering, while the angle of the vector represents the mean phase. Individual data points are plotted outside the circle. The central circle represents the threshold for p = 0.05. (D) Individual luminescence plots for the rhythmic populations of A. baumannii V15 pLPV1Z-pblsA::luc clone 1. The graph in E shows all traces of 17978 pLPV1Z-pblsA::luc clon B, n = 36, while only rhythmic samples are shown in (F), n = 19. Baseline-detrended, normalized luminescence is shown. Average endogenous period (FRP) of rhythmic populations of A. baumannii 17978 pLPV1Z-pblsA::luc clone B (24.67 ± 4 h, n = 19) and the time window for period calculation are indicated in the top right of B. A representative experiment (biological replica 1) from two biological replicates is shown. Individual wells are represented in colored lines. G Rayleigh plots showing the phase of the bioluminescent peak under constant darkness DD conditions for the rhythmic population (DD, black dots: 12.6 ± 5 h, n = 16; R = 0.1, for the rhythmic population). Lines represent the average peak phase of pLPV1Z-pblsA::luc activity (mean vectors for the circular distributions) of each group. The length of the vector represents the strength of the phase clustering, while the angle of the vector represents the mean phase. Individual data points are plotted outside the circle. The central circle represents the threshold for p = 0.05. (H) Individual luminescence plots for the rhythmic populations of A. baumannii 17978 pLPV1Z-pblsA::luc clon B. The parameters were determined using BioDare2. Bacteria were grown at a constant temperature of 23 °C. n = total number of samples; 1 sample = 1 well of a 96-well plate. n rhythmic = number of samples exhibiting circadian rhythmicity under free-running conditions (see Methods for definition).

References

    1. Swan, J. A., Golden, S. S., LiWang, A. & Partch, C. L. Structure, function, and mechanism of the core circadian clock in cyanobacteria. J. Biol. Chem.293, 5026–5034 (2018). - PMC - PubMed
    1. Eelderink-Chen, Z. et al. A circadian clock in a nonphotosynthetic prokaryote. Sci. Adv.7, 10.1126/sciadv.abe2086 (2021). - PMC - PubMed
    1. Sartor, F. et al. The circadian clock of the bacterium B. subtilis evokes properties of complex, multicellular circadian systems. Sci. Adv.9, eadh1308 (2023). - PMC - PubMed
    1. Paulose, J. K., Cassone, C. V., Graniczkowska, K. B. & Cassone, V. M. Entrainment of the Circadian Clock of the Enteric Bacterium Klebsiella aerogenes by Temperature Cycles. iScience19, 1202–1213 (2019). - PMC - PubMed
    1. Paulose, J. K., Wright, J. M., Patel, A. G. & Cassone, V. M. Human gut bacteria are sensitive to melatonin and express endogenous circadian rhythmicity. PloS one11, e0146643 (2016). - PMC - PubMed

MeSH terms

Substances

LinkOut - more resources