. 2025 Sep 30;15(1):34120.
doi: 10.1038/s41598-025-21287-w.

Radiomics-enhanced modelling approach for predicting the need for ECMO in ARDS patients: a retrospective cohort study

Affiliations

Radiomics-enhanced modelling approach for predicting the need for ECMO in ARDS patients: a retrospective cohort study

Martin Mirus et al. Sci Rep. .

Abstract

Decisions regarding veno-venous extracorporeal membrane oxygenation (vv-ECMO) in patients with acute respiratory distress syndrome (ARDS) are often based solely on clinical and physiological parameters, which may insufficiently reflect severity and heterogeneity of lung injury. This study aimed to develop a predictive model integrating machine learning-derived quantitative features from admission chest computed tomography (CT) with selected clinical variables to support early individualized decision-making regarding vv-ECMO therapy. In this retrospective single-center cohort study, 375 consecutive patients with COVID-19-associated ARDS admitted to the ICU between March 2020 and April 2022 were included. Lung segmentation from initial CTs was performed using a convolutional neural network (CNN) to generate high-resolution, anatomically accurate masks of the lungs. Subsequently, 592 radiomic features, quantifying lung aeration, density and morphology, were extracted. Four clinical parameters - age, mean airway pressure, lactate, and C-reactive protein, were selected on the basis of clinical relevance. Three logistic regression models were developed: (1) Imaging Model, (2) Clinical Model, and (3) Combined Model integrating different features. Predictive performance was assessed via the area under the receiver operating characteristic curve (AUROC), accuracy, sensitivity, and specificity. A total of 375 patients were included: 172 in the training and 203 in the validation cohort. In the training cohort, the AUROCs were 0.743 (Imaging), 0.828 (Clinical), and 0.842 (Combined). In the validation cohort, the Combined Model achieved the highest AUROC (0.705), outperforming the Clinical (0.674) and Imaging (0.639) Models. Overall accuracy in the validation cohort was 64.0% (Combined), 66.5% (Clinical), and 59.1% (Imaging). The Combined Model showed 68.1% sensitivity and 58.9% specificity. Kaplan-Meier analysis confirmed a significantly greater cumulative incidence of ECMO therapy in patients predicted as high risk (p < 0.001), underscoring its potential to support individualized, timely ECMO decisions in ARDS by providing clinicians with objective data-driven risk estimates. Quantitative CT features based on machine learning-derived lung segmentation allow early individualized prediction of the need for vv-ECMO in ARDS. While clinical data remain essential, radiomic markers enhance prognostic accuracy. The Combined Model demonstrates considerable potential to support timely and evidence-based ECMO initiation, facilitating individualized critical care in both specialized and general ICU environments.Trial registration: The study is registered with the German Clinical Trials Register under the number DRKS00027856. Registered 18.01.2022, retrospectively registered due to retrospective design of the study.

Keywords: CNN; CT; Computed tomography; Convolutional neural network; Critical care; Decision making; ECMO; Extracorporeal membrane oxygenation; Lung segmentation; Prediction; Radiomic.


Conflict of interest statement

Declarations. Competing interests: The authors declare no competing interests. Ethics approval and consent to participate: The study was conducted in accordance with the Declaration of Helsinki and approved by the responsible Ethics Committee of the Technical University of Dresden, Germany (BO-EK-374072021).

Figures
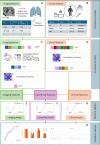
Fig. 1
Fig. 1
Study design: Model development for predicting veno-venous ECMO in ARDS patients. This figure depicts the process of developing and validating three machine learning models for predicting the need for vv-ECMO in ARDS patients. In the feature extraction phase, 592 imaging features were extracted through automated CT segmentation and quantitative image analysis (A), and five clinical features were obtained from electronic health records (B). During the feature selection phase, relevant features were selected. For imaging, a multi-step feature selection process including clustering, cross-validated Minimum Redundancy Maximum Relevance (MRMR) ranking and correlation analysis were performed (C). Clinical parameters were assessed for selection on the basis of correlation analysis (D). The selected features formed the basis for the training of the Imaging Model (E) and the Clinical Model (G). These feature sets were then combined to train the Combined Model (F). Finally, all the models were validated in the validation cohort (H).
Fig. 2
Fig. 2
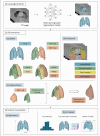
Three-phase process of quantitative image analysis for feature extraction. The figure illustrates the three phases of quantitative image analysis for feature extraction from CT images. (1). Lung segmentation: The lungs are first segmented from the CT scan to define the overall analysis region. (2). ROI extraction: Within the segmented lungs, ROIs are extracted in three categories: spatial (a) (e.g., anatomical compartments), functional (b) (e.g., aeration-based regions), and intersectional (c) (overlaps between spatial and functional ROIs). (3). Feature computation: Quantitative features are extracted from each ROI, including geometrical features (a) to describe the shape and structure of each ROI and HU-based characteristics (b) to quantify the tissue density in each ROI. CT: computed tomography; ROI: region of interest; HU: Hounsfield unit.
Fig. 3
Fig. 3
Hounsfield units (HUs) within different lung areas. Exemplary representation of the frequency of different HUs in the lungs of a COVID-19 patient (blue) from this study. For comparison, a healthy control (green) is included. The dashed vertical lines indicate the HU intervals used to subdivide the lungs into regions of different aeration conditions: hyperinflated, normally aerated, poorly aerated, and nonaerated. The frequency of HUs in the different areas differs between the two cases shown. While for the healthy controls (green), most HUs fell within the range of normal aeration, the COVID-19 patients exhibited a broader distribution extending into regions associated with poor and no aeration. HU: Hounsfield units.
Fig. 4
Fig. 4
Overview of the machine learning pipeline for feature reduction of the imaging data. (o) CT-based Lung Segmentation and subsequent feature extraction, as described previously, yielded many imaging features. (i) The 5 × 5 cross-validation is the experimental setup. The reduction process is performed on each development fold (dev 1–4) and begins with (ii) Feature Standardization, including z-normalization and Yeo–Johnson transformation, followed by (iii) Feature Clustering and Exclusion using hierarchical agglomerative clustering and best predictor selection. Filtering with the Mann–Whitney U test was used for irrelevant feature exclusion. (iv) Feature Ranking is carried out via the MRMR algorithm to identify the most informative variables. This was followed by (v) Model development via logistic regression and internal validation on the validation fold (val) of the training cohort. (vi) Final Signature is defined by aggregating the feature rankings over all five cross-validation folds on the basis of the Borda score. MRMR: minimal redundancy maximum relevance; dev: development fold of the training cohort; val: validation fold of the training cohort.
Fig. 5
Fig. 5
Study flow chart of patient inclusion. Retrospective patient screening was performed for patients admitted between March 2020 and March 2022. Patients who fulfilled the inclusion criteria and were admitted between March 19, 2020, and March 11, 2021, were allocated to the training cohort. Patients who fulfilled the inclusion criteria and were admitted to the ICU between March 11, 2021, and March 29, 2022 were allocated to the validation cohort.
Fig. 6
Fig. 6
Distribution of patients receiving vv-ECMO according to ARDS severity at admission. Sankey diagram illustrating the distribution of vv-ECMO therapy according to ARDS severity at admission. Patients were categorized as having mild, moderate, or severe ARDS on the basis of established criteria. The width of each flow corresponds to the number of patients transitioning from each ARDS severity category to either vv-ECMO or no-ECMO treatment. Among patients with severe ARDS, the majority received vv-ECMO (55/103), whereas patients with mild ARDS were less likely to receive vv-ECMO therapy (5/19). The incidence of moderate ARDS was nearly equal between the vv-ECMO (44/81) and no-ECMO (37/81) groups. ARDS: Acute respiratory distress syndrome. Freq. : Absolute number of patients in each group.
Fig. 7
Fig. 7
(A, B) Development and performance of the imaging model. (A) Correlation matrix for imaging features. Test of mutual correlation with Spearman correlation. The Spearman correlation coefficient is color-coded: blue indicates a positive correlation, whereas red represents a negative correlation. The intensity of the color reflects the strength of the correlation. The parameters are explained in Table S1 in the supplement. (B) Performance of the imaging model. The ROC curve for the Imaging Model in the training cohort (blue) had an AUROC of 0.743. The optimal threshold for the Imaging Model was determined via the Youden index, which yielded a value of 0.247. The performance of the Imaging Model in the validation cohort (red) resulted in an AUROC of 0.639.
Fig. 8
Fig. 8
(A, B) Development and performance of the clinical model. (A) Correlation matrix for clinical features. Test of mutual correlation with Spearman correlation. The Spearman correlation coefficient is color-coded: blue indicates a positive correlation, whereas red represents a negative correlation. The intensity of the color reflects the strength of the correlation. CRP: C-reactive protein; Pmean: mean airway pressure; PEEP: positive end expiratory pressure. (B) Performance of the clinical model. The ROC curve for the Clinical Model in the training cohort (blue) had an AUROC of 0.828. The optimal threshold for the Clinical Model were determined via the Youden index, which yielded a value of 0.225. The performance of the Clinical Model in the validation cohort (red) resulted in an AUROC of 0.674.
Fig. 9
Fig. 9
(A, B) Development and performance of the combined model. (A) Correlation matrix for combined features. Test of mutual correlation with Spearman. The Spearman correlation coefficient is color-coded: blue indicates a positive correlation, whereas red represents a negative correlation. The intensity of the color reflects the strength of the correlation. CRP: C-reactive protein; Pmean: mean airway pressure; PEEP: positive end expiratory pressure. (B) Performance of the combined model. The ROC curve for the Combined Model in the training cohort (blue) had an AUROC of 0.842. The optimal threshold for the combined model was determined via the Youden index, which yielded a value of 0.304. The performance of the Clinical Model in the validation cohort (red) resulted in an AUROC of 0.705.
Fig. 10
Fig. 10
Comparison of model performance. The ROC curves for the validation cohort, comparing the predictive performance of the Imaging Model (blue), the Clinical Model (brown), and the Combined Model (black). The area under the curve (AUROC) was 0.64 for the Imaging Model, 0.67 for the Clinical Model, and 0.71 for the Combined Model.
Fig. 11
Fig. 11
Outcomes in the validation cohort if the models guide transfer decisions. If ECMO prediction of the models would have led to transfer decisions, as in times of limited resources, transfer outcomes in the validation cohort would be as depicted in this figure. The x-axis groups predictions into four categories: correct transfer (true positives), missed transfer (false negatives), correct stay (true negatives), and unnecessary transfer (false positives). The percentages are shown for each outcome, with the Combined Model demonstrating the most balanced trade-off between avoiding unnecessary transfers and minimizing missed vv-ECMO cases.
Fig. 12
Fig. 12
Cumulative incidence of ECMO initiation and death by prediction group: comparison of cumulative incidence function (CIF) and Kaplan-Meier (KM) estimates. (A, C) Cumulative incidence of ECMO initiation stratified by model prediction (predicted no-ECMO “0” vs. predicted ECMO “1”) for the Imaging Model (A) and the Combined Model (C). Solid lines represent CIF estimates accounting for death as a competing risk, whereas dashed lines indicate naive KM estimates treating competing events as censoring. Patients predicted to require ECMO (yellow) consistently showed higher ECMO incidence compared with those predicted not to require ECMO (blue). KM estimates tended to overestimate ECMO initiation probabilities relative to CIF. (B, D) Cumulative incidence of death stratified by model prediction for the Imaging Model (B) and the Combined Model (D). CIF estimates (solid lines) indicated higher death incidence in the predicted no-ECMO group (red), reflecting poorer outcomes in patients without ECMO therapy, while patients predicted to require ECMO (turquoise) demonstrated lower death incidence due to the competing risk of ECMO initiation. Naive KM estimates (dashed lines) underestimated mortality in the predicted no-ECMO group and overestimated it in the predicted ECMO group. CIF, cumulative incidence function; ECMO, CR, competing risk; extracorporeal membrane oxygenation; KM, Kaplan-Meier.
Fig. 13
Fig. 13
(A, B) Influence of age and lactate level on ECMO prediction in the combined model. (A) and (B) depict the ECMO prediction in the Combined as a function of age and lactate level, assuming that the CT feature “normal ventilation” = 0.492 and that the fixed values for CRP (196.0) and Pmean (14.4) correspond to the mean values for all patients within this study. (A) Three-dimensional surface plot showing the joint effect of age and lactate concentration on ECMO prediction. Younger age and higher lactate levels are associated with a greater likelihood of ECMO prediction in the Combined Model. (B) Two-dimensional plot illustrating ECMO prediction by age, stratified by lactate level (1.0–5.0 mmol/L). ECMO prediction decreases with increasing age across all lactate strata, with higher lactate levels consistently increasing the predicted probability.

References

    1. Combes, A. et al. Extracorporeal membrane oxygenation for severe acute respiratory distress syndrome. N. Engl. J. Med.378 (21), 1965–1975 (2018). - PubMed
    1. Bos, L. D. J. & Ware, L. B. Acute respiratory distress syndrome: causes, pathophysiology, and phenotypes. Lancet400 (10358), 1145–1156 (2022). - PubMed
    1. Gorman, E. A., O’Kane, C. M. & McAuley, D. F. Acute respiratory distress syndrome in adults: diagnosis, outcomes, long-term sequelae, and management. Lancet400 (10358), 1157–1170 (2022). - PubMed
    1. Schmidt, M. et al. The PRESERVE mortality risk score and analysis of long-term outcomes after extracorporeal membrane oxygenation for severe acute respiratory distress syndrome. Intensive Care Med.39 (10), 1704–1713 (2013). - PMC - PubMed
    1. Pappalardo, F. et al. Predicting mortality risk in patients undergoing venovenous ECMO for ARDS due to influenza A (H1N1) pneumonia: the ecmonet score. Intensive Care Med.39 (2), 275–281 (2013). - PMC - PubMed

Associated data