. 2025 Sep 30;16(1):8678.
doi: 10.1038/s41467-025-63675-w.

Genetic tuning of retinal ganglion cell subtype identity to drive visual behavior

Affiliations

Genetic tuning of retinal ganglion cell subtype identity to drive visual behavior

Marcos L Aranda et al. Nat Commun. .

Abstract

The distinct blend of molecular and cellular features that define neuronal subtype identity are central to shaping how individual subtypes impact animal behavior. The diversity of the mammalian nervous system is vast - the retina alone contains over 100 neuronal subtypes. Yet, the genetic processes giving rise to this stunning structural and functional diversity remain poorly understood. Here, we uncover a graded expression pattern of the transcription factor BRN3B that tunes and maintains multiple, subtype-defining transcriptional and morphophysiological features of the melanopsin-expressing, intrinsically photosensitive retinal ganglion cells (ipRGCs) in mice. Disruption of BRN3B expression levels causes the transcriptional and morphophysiological identity of ipRGC subtypes to begin to converge, leading to dysfunction in multiple ipRGC-dependent behaviors. These findings show that graded levels of a single transcription factor can tune a diverse array of features to shape neuronal identity and circuit function to drive behavior.


Conflict of interest statement

Competing interests: J.D.B. is a co-founder of Aura Life Science, in which he has a financial interest. All other authors declare that they have no competing interests.

Figures
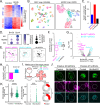
Fig. 1
Fig. 1. BRN3B confers molecular identity to ipRGC subtypes.
A Differentially expressed transcripts in control and Brn3bcKO ipRGCs. B ipRGCs identified from publicly available scRNA-Seq profiles of RGCs, re-analyzed using dimensionality reduction, and visualized with UMAP. Established genetic markers are used to annotate ipRGC subtypes. C Genes with increased and decreased expression in Brn3bcKO mice exhibited high variability in expression across ipRGC subtypes. DBrn3b and Opn4 mRNA levels in ipRGC subtypes. Relative expression of Opn4 and Brn3b mRNA in M1, M2, and M4 ipRGCs in scRNA-Seq dataset. E Top genes that were enriched in M4, M5, and M6 ipRGCs with high levels of Brn3b expression (Brn3bHigh) or in M1 and M2 ipRGC subtypes with low levels of Brn3b expression (Brn3bLow). F Brn3bcKO induces opposite effects on transcripts found in Brn3bLow and Brn3bHigh ipRGCs (n = 50,57,164 transcripts for Brn3bHigh, Brn3bLow,all ipRGCs). Box plots show median, quartiles (box) and range (whiskers). G Volcano plot of Brn3bcKO-induced changes in transcript expression using TRAP. Transcriptional regulators which define ipRGC subtypes and are dysregulated in Brn3bcKO are highlighted. (H) Brn3bcKO-induced changes in Chrna6 and Zcchc12 transcript expression using TRAP (n = 4 mice/group). Data show mean ± standard error. I Schematic representation of RNAscope in flat-mount retinas. J Representative RNAscope pictures in flat mount retinas showing Chrna6 and Zcchc12 mRNA expression in putative M4 and M1 ipRGCs (dashed ellipses) in control (Opn4Cre/+; Brn3b+/+) and Brn3bcKO mice. K Relative expression of Chrna6 (P = 0.0001) and Zcchc12 (P = 0.0002) mRNA in ipRGCs from control (gray, n = 183 cells) and Brn3bcKO (green, n = 242 cells) mice measured by RNAscope. Pie plots show an increased number of ipRGCs expressing Zcchc12 mRNA in Brn3bcKO mice (P = 0.003). Source data are provided as a Source Data file. Lines are median values, **P < 0.01, ***P < 0.001, two-tailed Mann-Whitney U and Fisher’s exact tests.
Fig. 2
Fig. 2. BRN3B represses melanopsin expression.
A Schematic representation of the RNAscope retinal cross-sections protocol. BOpn4 and Brn3b mRNA expression in control (Opn4Cre/+; Brn3b+/+) and Brn3bcKO retinal sections. Brn3b mRNA expression is absent in Brn3bcKO ipRGCs (dashed ellipse) and still present in other RGCs (arrowheads). C (Left) Opn4 mRNA levels are significantly increased in ipRGCs Brn3bcKO (green, n = 216 cells) compared to control (black, n = 336 cells) littermates (P = 0.0001). (Right) Opn4 mRNA levels are increased in iBrn3bcKO (green, n = 288 cells) compared to control ipRGCs (black, n = 371 cells) (P = 0.0001). D (Left) Schematic representation of melanopsin immunolabeling in flat-mount retinas. (Right) melanopsin immunolabeling in ipRGCs of adult control and Brn3bcKO retinas. E, F melanopsin levels are increased in Brn3bcKO ipRGCs (E) (n = 600 cells/group, P = 0.0001), with an increased proportion of ipRGCs expressing high levels of melanopsin (F) (n = 600 cells/group). Q1–Q5: quintiles showing low (Q1) to high (Q5) melanopsin levels. G, H melanopsin levels are increased in iBrn3bcKO compared to control ipRGCs (G) (n = 800 cells in Vehicle; n = 761 in TMX, P = 0.0001), with an increased proportion of ipRGCs expressing high levels of melanopsin (H) (n = 800 cells in Vehicle; n = 761 in TMX). Source data are provided as a Source Data file. Lines are median values, ****P < 0.001, two-tailed Mann Whitney U test.
Fig. 3
Fig. 3. BRN3B tunes morphological properties of ipRGC subtypes.
A Representative dendritic arbor tracing of M4 and M2 ipRGCs in control (Opn4Cre/+; Brn3b+/+) and Brn3bcKO mice. B Subtype identified by presence (M4) or absence (M2) of SMI-32 immunolabeling (dashed ellipses), examples are from Brn3bcKO cells. C (Top) Scheme of retrogradely labeling strategy of M1 ipRGCs. (Bottom) Representative dendritic arbor tracing of M1 ipRGCs in control and Brn3bcKO mice. D Sholl analysis of M4 (n = 30 cells in Control, n = 23 cells in Brn3bcKO), M2 (n = 5 cells per group) and M1 (n = 36 cells in Control, n = 18 cells in Brn3bcKO) ipRGC subtypes. ipRGCs from Brn3bcKO (green) mice present less complex dendritic arbors compared to control (black) mice. E, F Brn3bcKO showed decreased dendritic field diameter (E) (n = 30 cells in Control M4, n = 23 cells in Brn3bcKO M4, P = 0.013; n = 5 cells in M2 Control and Brn3bcKO, P = 0.028; and Brn3bcKO, n = 36 cells in Control M1 and n = 18 cells in Brn3bcKO M1, P = 0.0004) and soma size (F) (n = 30 cells in Control M4, n = 23 cells in Brn3bcKO M4, P = 0.016; n = 24 cells in Control M2, n = 32 cells in Brn3bcKO, P = 0.0001; and Brn3bcKO, n = 36 cells in Control M1 and n = 19 cells in Brn3bcKO M1, P = 0.0004) in M4, M2 and M1 ipRGC subtypes than control mice. Source data are provided as a Source Data file. All data are Mean ± SEM, *P < 0.05, ***P < 0.001, two-tailed Student’s t- and Mann Whitney U tests.
Fig. 4
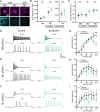
Fig. 4. BRN3B tunes physiological properties of ipRGC subtypes.
A Representative pictures of M4, M2 and M1 ipRGCs (dashed ellipses) filled with neurobiotin (NB) used for electrophysiological recordings. B Brn3bcKO M4 ipRGCs (green, n = 9 cells) showed increased input resistance compared to control M4 ipRGCs (black, n = 10 cells) (P = 0.04), while no differences were observed in M2 (n = 7 cells in Control, n = 5 cells in Brn3bcKO; P = 0.24) and M1 (n = 7 cells in Control, n = 5 cells in Brn3bcKO; P = 0.45) ipRGCs. C M2 ipRGC subtype in Brn3bcKO retinas showed increased resting membrane potential (n = 7 cells in Control, n = 4 cells in Brn3bcKO; P = 0.03) while no differences were observed in M4 (n = 10 cells in Control, n = 11 cells in Brn3bcKO; P = 0.29) and M1 (n = 7 cells in Control, n = 3 cells in Brn3bcKO; P = 0.69) ipRGCs. DF representative excitability traces from M4 (D), M2 (E) and M1 (F) ipRGCs in Control (black) and Brn3bcKO (green) retinas. G Brn3bcKO M4 ipRGCs reached peak firing rate by 300pA and then showed marked depolarization block (n = 5 cells in Control, n = 7 cells in Brn3bcKO; 350 pA P = 0.02, 400 pA P = 0.001). H, I No differences were observed in excitability experiments in M2 (H, n = 7 per group) and M1 (I, n = 7 in Control, n = 3 in Brn3cKO) ipRGCs. Source data are provided as a Source Data file. All data are Mean ± SEM, *P < 0.05, ***P < 0.001, two-tailed Student’s t- and Mann Whitney U tests and two-way repeated measures ANOVA with Tukey’s multiple comparisons test.
Fig. 5
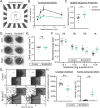
Fig. 5. BRN3B is a central regulator of ipRGC-driven behaviors.
A Schematic showing the optokinetic tracking (OKT) behavioral assay. B Contrast sensitivity curve at different spatial frequencies. Brn3bcKO mice (green, n = 6) showed decreased contrast sensitivity compared to control (Opn4Cre/+; Brn3b+/+) mice (black, n = 12) (0.031 cpd, P = 0.176; 0.064 cpd, P = 0.006; 0.092 cpd, P = 0.011; 0.272, P = 0.128). C Spatial frequency threshold measured by OKT at 100% contrast in control (black, n = 9) and Brn3bcKO (green, n = 5) mice. No differences between Brn3bcKO and control littermates (P = 0.106). D Representative PLR images from control (left) and Brn3bcKO (right) mice in darkness (top), dim light (middle, 13.8 log quanta cm−2 s − 1), and bright light (bottom, 14.8 log quanta cm−2 s − 1). Pupils are highlighted with dashed ellipses. E Control and Brn3bcKO (n = 6 mice/group) pupil area in the dark (P = 0.626). F Irradiance-response relationship of PLR in control (black) and Brn3bcKO (green) mice (n = 6 mice/group) (12.1 log quanta/cm2/s, P = 0.997; 13.8 log quanta/cm2/s, P = 0.673; 14.2 log quanta/cm2/s, P = 0.190; 14.8 log quanta/cm2/s, P = 0.010). G Representative double-plotted actograms from control (top) and Brn3bcKO (bottom) mice. Mice were initially exposed to a 12:12 LD cycle with 100 lux light during the light phase. Then, the mice were exposed to a 6 h phase advance. H Circadian amplitude measured using the peak amplitude of the χ2 periodogram in control (black, n = 8) and Brn3bcKO mice (green, n = 7) (P = 0.002). (Left); and percent activity during the light phase (Right) in control (black, n = 8) and Brn3bcKO mice (green, n = 7) (P = 0.006). Source data are provided as a Source Data file. All data are Mean ± SEM, n.s. (not significant) P > 0.05; *P < 0.05; **P < 0.01. Two-tailed Mann-Whitney U test and two-way repeated measures ANOVA with Tukey’s multiple comparisons test.

Update of

References

    1. Baden, T. et al. The functional diversity of retinal ganglion cells in the mouse. Nature529, 345–350 (2016). - PMC - PubMed
    1. Bae, J. A. et al. Digital museum of retinal ganglion cells with dense anatomy and physiology. Cell173, 1293–1306 e1219 (2018). - PMC - PubMed
    1. Tran, N. M. et al. Single-cell profiles of retinal ganglion cells differing in resilience to injury reveal neuroprotective genes. Neuron104, 1039–1055 e1012 (2019). - PMC - PubMed
    1. Martersteck, E. M. et al. Diverse central projection patterns of retinal ganglion cells. Cell Rep.18, 2058–2072 (2017). - PMC - PubMed
    1. Morin, L. P. & Studholme, K. M. Retinofugal projections in the mouse. J. Comp. Neurol.522, 3733–3753 (2014). - PMC - PubMed

LinkOut - more resources