

Developing an optimized parameterization scheme for deriving a lightning threat product from a global model for all seasons over India
- PMID: 41028855
- PMCID: PMC12484601
- DOI: 10.1038/s41598-025-01521-1
Developing an optimized parameterization scheme for deriving a lightning threat product from a global model for all seasons over India
Abstract
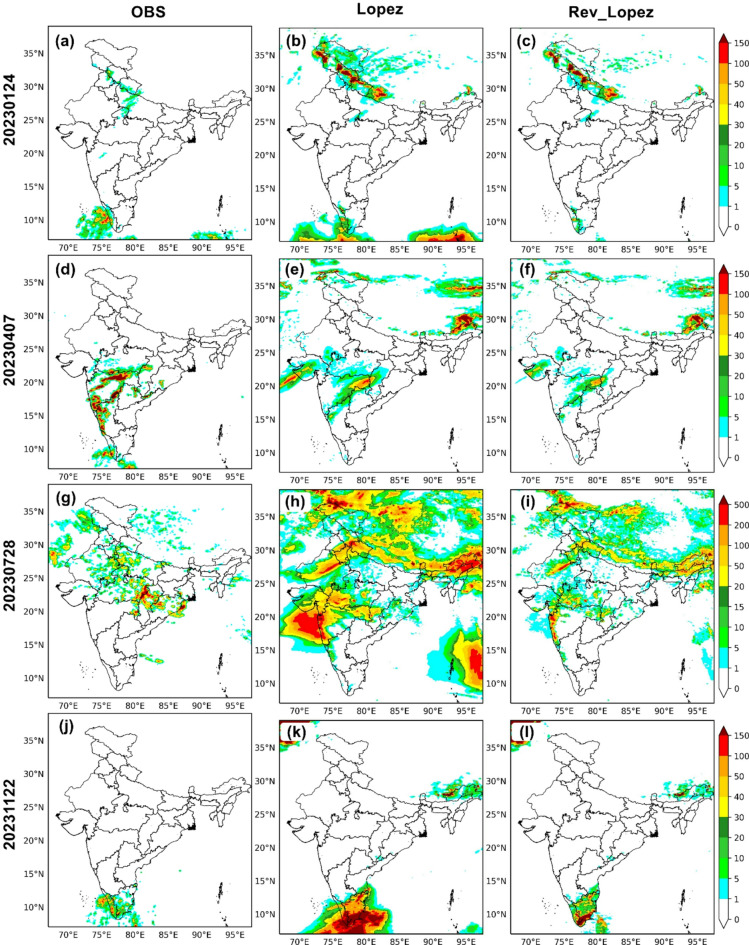
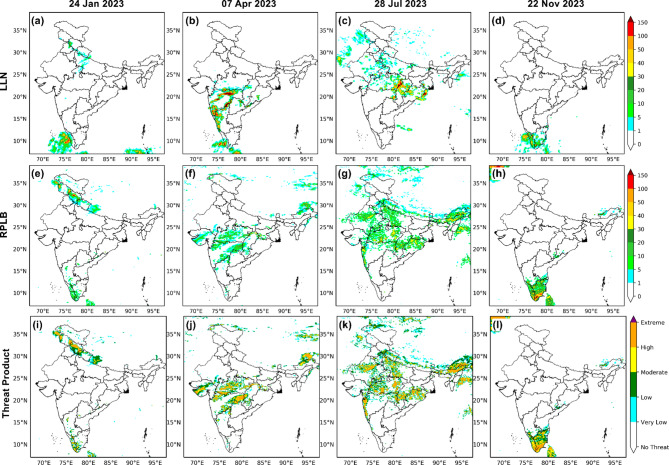
This study marks the utilization of medium-range forecasts of cloud-to-ground (CG) lightning threats over India across all seasons from a global model. CG flashes are derived from two lightning parameterization schemes: Price and Rind (PR92) scheme and Lopez Scheme and is evaluated against earth network lightning sensor data. Both methods with existing storm detection criteria initially produced a lightning with overestimated counts and large spatial extent. Hence a Revised PR92-Lopez Blended (RPLB) scheme is developed by redefining the storm detection points in each scheme and combined them by giving separate weights for land and ocean through a regression-based approach. RPLB gives an improved skill in spatial and frequency distribution, and reduced false alarms with respect to the individual schemes up to a five-day lead time. The estimated CG flashes are then categorized into threat levels ranging up to extreme for effective use in the early warning and decision support systems.
Keywords: Cloud-to-Ground lightning threat; Lightning parameterization; Lopez scheme; PR92 scheme.
© 2025. The Author(s).
Conflict of interest statement
Declarations. Competing interests: The authors declare no competing interests.
Figures


References
-
- Mills, B., Unrau, D., Pentelow, L. & Spring, K. Assessment of lightning-related damage and disruption in Canada. Nat. Hazards. 52, 481–499 (2010).
-
- Cooray, V., Cooray, C. & Andrews, C. J. Lightning caused injuries in humans. J. Electrostat. 65, 386–394 (2007).
-
- Gomes, C. & Kadir, M. Z. A. A. A theoretical approach to estimate the annual lightning hazards on human beings. Atmos. Res.101, 719–725 (2011).
-
- Nizamuddin, S. Deaths caused by lightning in India. Weather47, 366–367 (1992).
-
- Castle, W. & Kreft, J. A. Survey of deaths in Rhodesia caused by lightning. Cent. Afr. J. Med.20, 92–95 (1974). - PubMed
LinkOut - more resources
Full Text Sources
