[Preprint]. 2025 Sep 2:2025.08.28.672891.
doi: 10.1101/2025.08.28.672891.

A Common PD-Risk GBA1 Variant Disrupts LIMP2 Interaction, Impairs Glucocerebrosidase Function, and Drives Lysosomal and Mitochondrial Dysfunction

Affiliations

A Common PD-Risk GBA1 Variant Disrupts LIMP2 Interaction, Impairs Glucocerebrosidase Function, and Drives Lysosomal and Mitochondrial Dysfunction

Oliver B Davis et al. bioRxiv. .

Abstract

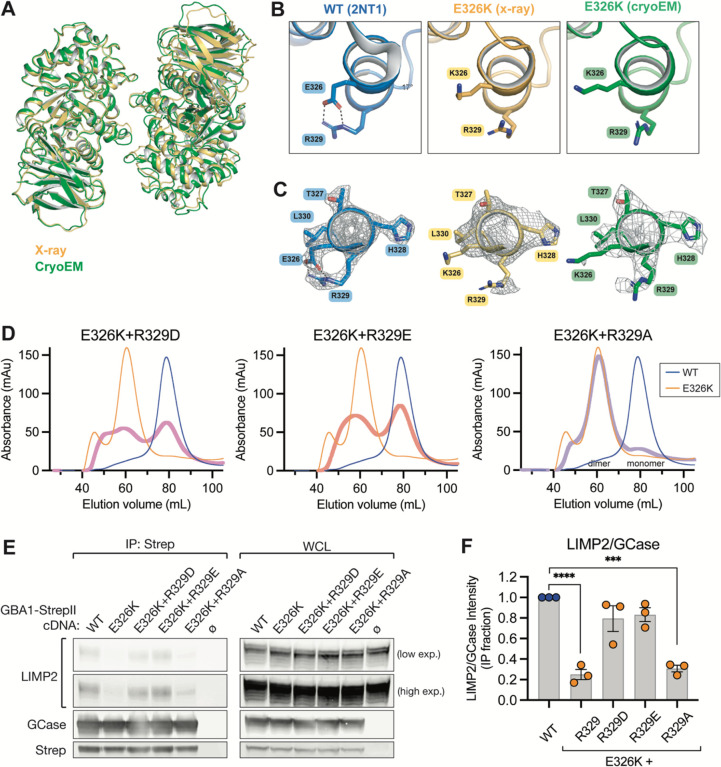
Variants in GBA1 cause Gaucher disease (GD), a lysosomal storage disorder, and represent the most common genetic risk factor for Parkinson's disease (PD). While some GBA1 variants are associated with both GD and PD, several coding mutations, including E326K, specifically confer risk for developing PD. It is established that GD-linked variants in β-glucocerebrosidase (GCase), the enzyme encoded by GBA1, are loss-of-function, but it remains unclear whether variants solely associated with PD similarly reduce GCase activity. The mechanisms by which some of these variants impact GCase activity and PD-associated pathways, including lysosomal and mitochondrial function, are also poorly defined. Here, we show that the PD-linked E326K variant significantly reduces lysosomal GCase activity by impairing its delivery to lysosomes via altered interactions with its receptor, LIMP2. Biophysical and structural characterization of this variant, both alone and in complex with LIMP2, reveals a dimeric organization that appears to result from the loss of a key salt bridge between E326 and R329. Restoration of this salt bridge through the introduction of a negatively charged side chain at position 329 promotes monomeric organization and interaction with LIMP2 in cells. GBA1-p.E326K cell models show greater deficits in PD-linked pathways compared to more severe loss of GCase function, including secondary lysosomal lipid storage and mitochondrial dysfunction. We confirm the E326K variant impacts GCase pathway activity in relevant CNS cell types, including iPSC-derived microglia, and in biofluids from heterozygous GBA1-p.E326K variant carriers. Together, our data provide key insights into the nature of GCase dysfunction in GBA1-PD and can inform the development of GCase-targeted therapeutic strategies to treat PD.


Conflict of interest statement

Competing interests The authors declare the following competing interests: O.B.D, L.R., J.E.K., S.S.D., R.G., S.V.A., N.S.G., J.H.K., E.T., M.A., J.P.C., M.T.M., A.H.N., H.N.N., N.E.P., E.I.L., T.Y., K.X., R.A.P.S., R.L., J.C.U., S.B., H.P.B., M.P., A.N.Q., X.W., G.D.P., M.S.K., C.S.M., A.A., J.H.S., and A.G.H. were full time employees and shareholders of Denali Therapeutics during the course of this work. X.W. and M.A. are currently employees of Tenvie Therapeutics.

Figures

Figure 1.
Figure 1.. GBA1-p.E326K causes a loss of GCase activity in cells through impaired lysosomal targeting.
A Representative micrographs of data quantified in B from WT, GBA1-p.E326K KI, GBA1-p.L444P KI, and GBA1 KO cells depicting LysoFQ-GBA probe fluorescence (green). Nuclei stained with DAPI (blue); scale bar is 10 μm. B WT, GBA1-p.E326K KI, GBA1-p.L444P KI, and GBA1 KO HEK293T cells were stained with LysoFQ-GBA probe to measure lysosomal GCase activity, and the mean GCase activity for each clone is quantified as the sum LysoFQ-GBA spot intensity per nuclei, normalized to the mean of all WT cells. n = 3 independent experiments. C Representative immunoblot of whole cell lysates from HEK293T cells of indicated genotype assessed with antibodies against GCase and actin as a loading control. D Quantification of total cellular GCase enzyme levels, measured via immunoblot & normalized to the levels of actin and the mean signal from WT cells. n = 3 independent experiments. E Representative immunoblot of Lyso-IP samples from HEK293T cells (of indicated genotype) expressing TMEM192-HAx3 tag. Immunoblots were probed using antibodies against GCase, HA, NPC2, and LIMP2. F Quantification of lysosomal GCase levels (normalized per sample to HA band intensity), measured via immunoblotting of Lyso-IP fraction and normalized to the mean of all WT samples. n = 4 independent experiments. G Representative immunoblot of total cell lysates from HEK293T cells of indicated genotype, treated ± Endoglycosidase H (EndoH), and probed using antibodies against GCase and actin as a loading control. H Quantification of the EndoH-resistant GCase band intensity normalized to the total GCase band intensity, from EndoH-treated cell lysates from HEK293T cells of indicated genotype. n = 4 independent experiments. I Representative immuoblots from Strep-Tactin pulldowns performed on lysates from GBA1 KO HEK293T cells transfected with StrepII-tagged GBA1 cDNA for WT GBA1 and GBA1-p.E326K. Immunoblots were probed using antibodies against LIMP2, GCase and Strep. J Quantification of LIMP2:GCase band intensity ratios, normalized to the WT GBA1/pH 7.3 lysis condition within each replicate, from pulldown fraction of experiment shown in I. n = 4 independent experiments. All bar graphs depict mean ± SEM with individual points representative of data from a single experimental replicate. Unless otherwise noted, all statistics were performed on genotype-level comparisons using one-way ANOVA with Dunnett’s multiple comparison test, where ** = p < 0.0021, *** = p < 0.0002, **** = p < 0.0001.
Figure 2.
Figure 2.. Biochemical and structural characterization of the E326K variant and in vitro interaction with LIMP2.
A Enzymatic activity of purified recombinant GCase (WT or E326K) against the substrate 4-methylumbelliferyl b-glucopyranoside (4-MUG), at an enzyme concentration of 2 nM. Curves depict data fits to Michaelis-Menten kinetics model (top). B Selected enzymatic parameters, derived from Michaelis-Menten kinetics shown in B. C Enzymatic activity of purified recombinant GCase (WT or E326K) against GlcCer in liposomes prepared with either neutral lipids (gray bars) or with 30% BMP (orange bars). Imiglucerase is colored in grey, recombinant WT GCase in blue and E326K in orange. n = 3 independent experiments. All bar graphs depict mean ± SEM with individual points representative of data from a single experimental replicate. D Overlay of size exclusion chromatography profiles of purified WT (blue) and E326K (orange) GCase. Samples were run over a Superdex S200 3.2/100 pre-equilibrated in 20mM sodium acetate pH 5.5 and 150mM NaCl and absorbance at 280nm was recorded. Early elution profile for E326K suggests that protein behaves as a multimer compared to WT GCase. Void volume is expected around 0.9mL confirming E326K is not a soluble aggregate. E Binding affinities measured by SPR for the LIMP2-GCase interaction at both neutral and acidic pHs, with LIMP2 lumenal domain immobilized on the chip. Values correspond to the average of 2 independent replicates, using either a 1:1 (top table) or biphasic (bottom table) binding model. F SEC-MALS analysis of the GCase E326K / LIMP2 complex is consistent with a 2:2 dimeric organization (observed molecular weight ~ 200 kDa, expected MW for GCase ~50kDa and LIMP2 extracellular domain ~45kDa, not accounting for glycosylation). Absorbance trace is shown in blue, and apparent molecular weight is shown in purple. G CryoEM reconstruction of the E326K variant & LIMP2 lumenal domain complex at a resolution of 3.3 Å. Two orthogonal side views of an isosurface rendering of the complex are shown. LIMP2 N- and C- termini are indicated relative to the lysosomal membrane. H Cartoon representation of the E326K variant & LIMP2 complex structure (center). K326 in both E326K variant protomers is shown in red spheres. Overlay of Loop 1 in E326K variant & LIMP2 complex structure with helical (blue) and extended (green) conformations of Loop 1 observed in WT GCase at neutral pH (PDB: 2NT1, chains A and B) and (top left). Close-up view of E326K dimer interface showing that the interface consists primarily of hydrophobic interactions (upper right). Close-up view of interactions forming the E326K variant interface with LIMP2 (bottom left). Close-up view of the electrostatic interactions at the LIMP2 dimer interface (bottom right).
Figure 3.
Figure 3.. A salt bridge between residues 326 and 329 regulates GCase self-association and binding to LIMP2 in cells.
A Crystal structure of the GCase E326K variant dimer at 3.1 Å. Overlay of the E326K variant dimer observed in the crystal structure of E326K alone (gold) and the cryoEM structure of the E326K variant & LIMP2 complex (green). B Close-up view of the interactions of residue 326 in GCase structures. In WT GCase (PDB:2NT1, blue) the carboxylic side chain of Glu326 engages in a salt bridge interaction with guanidium group of R329. This electrostatic interaction is lost in both the E326K variant crystal structure (gold) and the cryoEM structure of the E326K variant & LIMP2 complex (green). C Corresponding electron density (mesh representation) for panel B (contoured at 1σ for the WT and E326K crystal structures, and 8σ for the E326K/LIMP2 cryoEM structure), showing that the E326 and R329 sidechains are both well-ordered and well-resolved in WT GCase, while the K326 and R329 sidechains are more disordered in the E326K variant. D Size exclusion chromatography profiles of purified E326K+R329A (purple), E326K+R329E (light red), and E326K+R329A (violet) recombinant enzyme. Elution profiles for WT GCase and E326K variant are shown in blue and orange, respectively. Elution profiles of monomeric and dimeric proteins are indicated with text. E Representative immunoblot from Strep-Tactin pulldowns performed on lysates from GBA1 KO HEK293T cells transfected with StrepII-tagged GBA1 cDNA for WT GBA1, GBA1-p.E326K, and E326K+R329D/E/A variants. Immunoblots were probed using antibodies against LIMP2, GCase and Strep. F Quantification of LIMP2:GCase band intensity ratios, normalized to the WT GBA1 transfected condition within each replicate, from pulldown fraction of experiment shown in E. n = 3 independent experiments, statistics performed using one-way ANOVA with Dunnett’s multiple comparison test to WT GCase, where *** = p < 0.0002, **** = p < 0.0001. All bar graphs depict mean ± SEM with individual points representative of data from a single experimental replicate.
Figure 4.
Figure 4.. GBA1-p.E326K causes a mild accumulation of GCase substrates in the lysosome and greater perturbations to glycosphingolipid and BMP homeostasis.
A Heatmaps depicting log2 fold changes (from WT mean) in the abundance of all detected GCase substrates from whole-cell and Lyso-IP fractions taken from WT, GBA1-p.E326K KI, GBA1-p.L444P KI, and GBA1 KO HEK293T cells. B The fold change (over WT mean) of glucosylsphingosine (GlcSph) levels in Lyso-IP samples from HEK293T cells of the indicated genotype. C Schematic depicting the major lipids and key enzymes/protein co-factors in the lysosomal glycosphingolipid degradation pathway proximal to GCase. D Heatmaps showing the log2 fold change (from WT mean) of glycosphingolipids (from pathway shown in c) in both whole-cell and Lyso-IP fractions taken from HEK293T cells of indicated genotype. Only lipids with a fold change of E326K vs WT that reached nominal significance (p < 0.1) in either the whole-cell or Lyso-IP fractions are included. E Fold change (over WT mean) of BMP(22:6/22:6) levels in Lyso-IP samples from HEK293T cells of the indicated genotype. F Fold change (over WT mean) of glucosylsphingosine levels in whole cell samples from HEK293T cells of the indicated genotype, treated with imiglucerase as indicated. G & H Fold change (over WT mean) of BMP(22:6/22:6) (G) or GB3(d18:1/18:0) (H) levels in whole cell samples from HEK293T cells of the indicated genotype, treated with imiglucerase as indicated. All bar graphs show mean ± SEM with individual points representative of data from a single experimental replicate. Data in A-B, and D-E are from n = 4 independent replicates. Data in F-H are from n = 5 independent replicates. For A and D, statistical tests were performed on genotype-level comparisons using robust linear model as described in methods and significance threshold was set at FDR adjusted P value < 0.05. All other statistical tests were performed on genotype-level comparisons using one-way ANOVA with Dunnett’s multiple comparison test (B and E), or Tukey’s multiple comparisons test (F-H), where * = p < 0.0332, *** = p < 0.0002, **** = p < 0.0001.
Figure 5.
Figure 5.. Proteomic analysis of purified lysosomes reveals GBA1-p.E326K specific cellular dysfunctions.
A Venn diagram showing overlap in the identity of proteins with significantly altered abundance in lysosomes isolated from GBA1-p.E326K KI, GBA1-p.L444P KI HEK293T, and GBA1 KO cells, relative to lysosomes isolated from WT cells. B Volcano plots showing differential abundance of proteins identified in Lyso-IP samples from indicated GBA1 variant or KO cells compared to WT cells. Proteins with significantly changed abundance (p < 0.05; absolute log2FC ≥ 0.5) are highlighted in red or blue for increased or decreased abundance, respectively. Proteins identified as mitochondrial in origin in the MitoCarta 3.0 database are highlighted in purple. C The number of proteins identified in each GBA1 variant or KO genotype belonging to the top ten most significant GO: Cell Component terms associated with the subset of significantly depleted proteins in E326K (vs WT) lysosomes. D Oxygen consumption rate (OCR) of HEK293T cells of indicated genotype, measured using Seahorse XF Cell Mito Stress Test assay. n = 3 independent experiments. E HEK293T cells of indicated genotype were stained with TMRM and MitoTracker Green, and the ratio of the sum (per nuclei) TMRM fluorescence to MitoTracker Green fluorescence, normalized to the mean of all WT cells, is plotted. n = 3 independent experiments. F Heatmap of the relative abundance of all identified glycosphingolipid hydrolases (related to the pathway shown in 2c) is shown as log2 fold change (from WT mean) for both whole-cell and Lyso-IP samples from HEK293T cells of indicated genotype. Analytes that were not detected in a sample are shaded gray. G Representative immunoblot of Lyso-IP samples from HEK293T cells (of indicated genotype) expressing TMEM192-HAx3 tag. Immunoblots were probed with antibodies against GLA, GM2A, SGSH, and HA as a loading and lysosomal isolation control. H Quantification of lysosomal GLA levels (normalized per sample to HA band intensity), measured via immunoblotting of Lyso-IP fraction & normalized to mean of all WT samples. n = 3 independent experiments. Bar graphs in E and H show mean ± SEM with individual points representative of data from separate experimental replicates. All proteomics data (A-C, F) is from n = 3 independent experiments. Unless otherwise noted, all statistical tests were performed on genotype-level comparisons using robust linear model as described in methods and significance threshold was set at FDR adjusted P value < 0.05. Statistics in E and H were performed on genotype-level comparisons using one-way ANOVA with Dunnett’s multiple comparison test, where * = p < 0.0332, ** = p < 0.0021, **** = p < 0.0001.
Figure 6.
Figure 6.. E326K knock-in mice recapitulate the primary GCase loss-of-function phenotypes observed in cellular models.
A Glucosylsphingosine levels in bulk brain lysates from mice of indicated genotype are shown, normalized to the mean of all WT animals. n = 10 animals per genotype. B GCase enzymatic activity was measured in bulk brain lysates from mice of indicated genotype by assessing turnover of 4-MUG substrate. C Immunoblot showing GCase levels from bulk brain lysates from mice of indicated genotype. D Quantification of GCase band intensity (normalized per sample to actin band intensity), normalized to the mean of all WT samples. E Lysosomal GCase activity, quantified in microglial cell populations from dissociated mouse brain samples stained with LysoFQ-GBA. For B-E, n = 5 animals/genotype. All bar graphs depict mean ± SEM with individual points representative of data from an individual animal. Unless otherwise noted, all statistics were performed on genotype-level comparisons using one-way ANOVA with Dunnett’s multiple comparison test, where * = p < 0.0332, *** = p < 0.0002, **** = p < 0.0001.
Figure 7.
Figure 7.. Human E326K-knock in iPSC-derived microglial cells have reduced GCase activity and accumulation of BMP and glycosphingolipids.
A Lysosomal GCase activity, measured in WT, GBA1-p.E326K, and GBA1 KO human iMicroglia stained with LysoFQ-GBA, is quantified as sum LysoFQ-GBA spot intensity per nuclei, normalized to the mean of all WT cells. n = 3 independent experiments. B Representative immunoblot showing GCase levels in human iMicroglia of indicated genotype. C Quantification of total cellular GCase enzyme levels (normalized to actin) in human iMicroglia of indicated genotype, measured via immunoblot & normalized to mean of all WT cells. n = 3 independent experiments. D Heatmap of whole-cell log2 fold change (from WT mean) abundance of all detected GCase substrates from human iMicroglia of indicated genotype. Shaded cells indicate values capped at log2 fold change = 5. E Fold change (over WT mean) of glucosylsphingosine levels in whole-cell samples from human iMicroglia of the indicated genotype. F Heatmap of log2 fold change (from WT mean) of BMPs & related species from human iMicroglia of indicated genotype. G Heatmap of log2 fold change (from WT mean) of glycosphingolipids from human iMicroglia of indicated genotype. For F and G, only species with a fold change of E326K vs WT that reached nominal significance (p < 0.1) are included. Lipidomics analysis (D-G) was done using a robust linear model as described in methods and significance threshold was set at FDR adjusted p value < 0.05, from n = 3 independent experiments. Statistics in A, C, and E, were performed on genotype-level comparisons using one-way ANOVA with Dunnett’s multiple comparison test, where * = p < 0.0332, **** = p < 0.0001.
Figure 8.
Figure 8.. Evidence of GCase loss-of-function and enhanced secondary lipid storage in biofluid samples from human GBA1-p.E326K carriers in the PPMI cohort.
A Whole blood-derived GCase activity (μmol/L/hr) is plotted in GBA1-p.E326K carriers (n = 19), GBA1 pathogenic variant carriers (n = 14), and subjects who do not carry either (n = 346). B and C The levels of selected plasma metabolites (adjusted area ratio), glucosylsphingosine (B) and GB3 (d18:1/24:0) (C), plotted from GBA1-p.E326K carriers (n = 14), GBA1 pathogenic variant carriers (n = 159), and subjects who do not carry either (n = 410). P-values are derived from linear models comparing GBA1-p.E326K carriers or GBA1 pathogenic variant carriers to non-carriers, adjusted for age, sex, PD case status, and 3 principal components derived from genome-wide WGS data (see Methods). Gray circles denote controls and colored circles (blue, orange, or red, for non-carriers, p.E326K carriers, and pathogenic variant carriers, respectively) denote PD cases.

References

    1. Hertz E., Chen Y., and Sidransky E. (2024). Gaucher disease provides a unique window into Parkinson disease pathogenesis. Preprint at Nature Research, https://doi.org/10.1038/s41582-024-00999-z 10.1038/s41582-024-00999-z. - DOI
    1. Stirnemann J., Belmatoug N., Camou F., Serratrice C., Froissart R., Caillaud C., Levade T., Astudillo L., Serratrice J., Brassier A., et al. (2017). A Review of Gaucher Disease Pathophysiology, Clinical Presentation and Treatments. Int J Mol Sci 18, 441. 10.3390/ijms18020441. - DOI - PMC - PubMed
    1. Migdalska-Richards A., and Schapira A.H. V. (2016). The relationship between glucocerebrosidase mutations and Parkinson disease. J Neurochem 139, 77–90. 10.1111/jnc.13385. - DOI - PMC - PubMed
    1. Ron I., and Horowitz M. (2005). ER retention and degradation as the molecular basis underlying Gaucher disease heterogeneity. Hum Mol Genet 14, 2387–2398. 10.1093/hmg/ddi240. - DOI - PubMed
    1. Bendikov-Bar I., Ron I., Filocamo M., and Horowitz M. (2011). Characterization of the ERAD process of the L444P mutant glucocerebrosidase variant. Blood Cells Mol Dis 46, 4–10. 10.1016/j.bcmd.2010.10.012. - DOI - PubMed

Publication types

LinkOut - more resources