

This is a preprint.
Spatio-temporal dynamics of lateral Na+ diffusion in apical dendrites of mouse CA1 pyramidal neurons
- PMID: 41030977
- PMCID: PMC12478378
- DOI: 10.1101/2025.08.06.668873
Spatio-temporal dynamics of lateral Na+ diffusion in apical dendrites of mouse CA1 pyramidal neurons
Update in
-
Spatiotemporal Dynamics of Lateral Na+ Diffusion in Apical Dendrites of Mouse CA1 Pyramidal Neurons.J Neurosci. 2025 Oct 29;45(44):e0077252025. doi: 10.1523/JNEUROSCI.0077-25.2025. J Neurosci. 2025. PMID: 40957679
Abstract
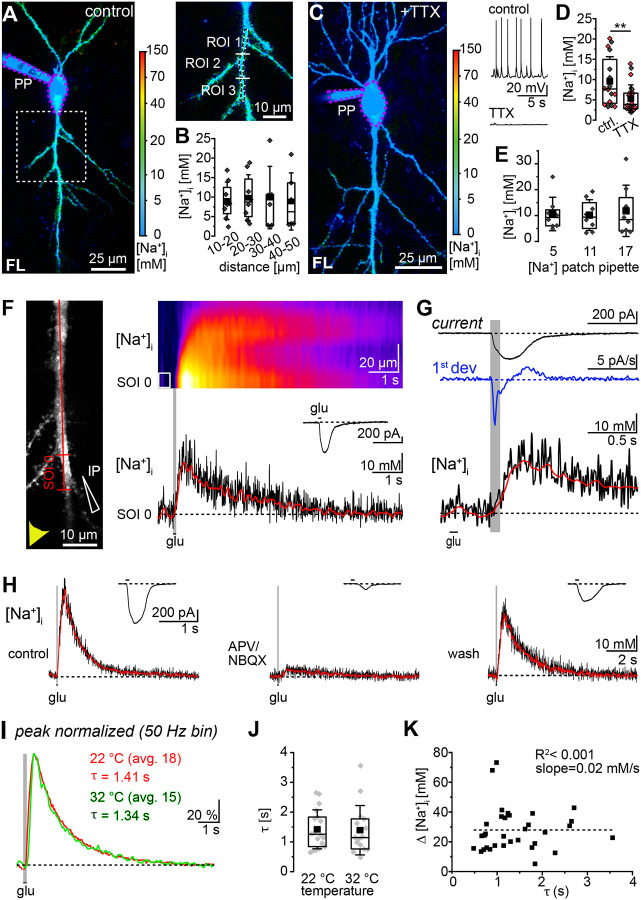
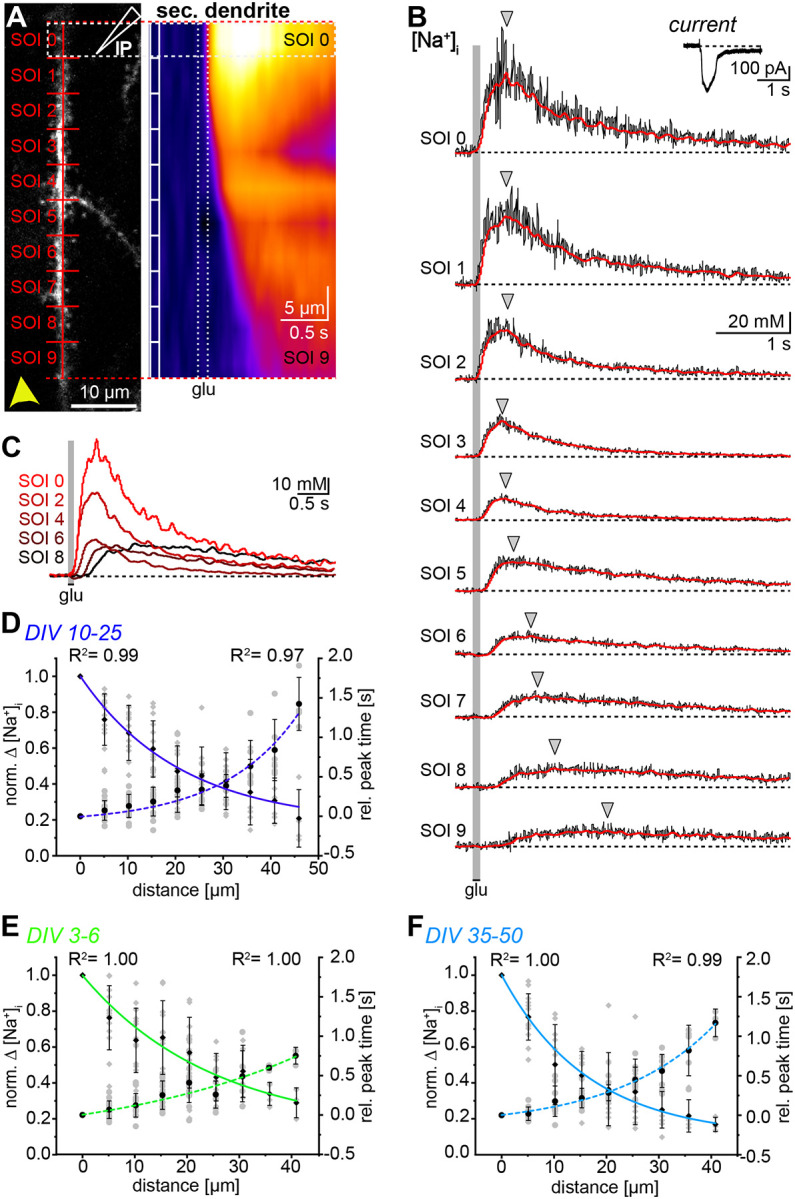
Sodium ions are major charge carriers mediating neuronal excitation and play a fundamental role in brain physiology. Glutamatergic synaptic activity is accompanied by large transient increases, but the spatio-temporal dynamics of signals and properties of diffusion within dendrites are largely unknown. To address these questions, we employed multi-photon imaging combined with whole-cell patch-clamp in dendrites of CA1 pyramidal neurons in tissue slices from mice of both sexes. Fluorescence lifetime microscopy revealed a dendritic baseline concentration of ~10 mM. Using intensity-based line-scan imaging we found that local, glutamate-evoked signals spread rapidly within dendrites, with peak amplitudes decreasing and latencies increasing with increasing distance from the site of stimulation. Spread of along dendrites was independent of dendrite diameter, order or overall spine density in the ranges measured. Our experiments also show that dendritic readily invades spines and suggest that spine necks may represent a partial diffusion barrier. Experimental data were well reproduced by mathematical simulations assuming normal diffusion with a diffusion coefficient of . Modeling moreover revealed that lateral diffusion is key for the clearance of local increases at early time points, whereas when diffusional gradients are diminished, -ATPase becomes more relevant. Taken together, our study thus demonstrates that influx causes rapid lateral diffusion of within spiny dendrites. This results in an efficient redistribution and fast recovery from local transients which is mainly governed by concentration differences.
Conflict of interest statement
Conflict of interest statement: The authors declare no competing financial interests.
Figures


References
Publication types
Grants and funding
LinkOut - more resources
Full Text Sources
Miscellaneous