. 2025 Oct 24;137(10):1255-1275.
doi: 10.1161/CIRCRESAHA.125.326353. Epub 2025 Oct 1.

Macrophage DNases Limit Neutrophil Extracellular Trap-Mediated Defective Efferocytosis in Atherosclerosis

Affiliations

Macrophage DNases Limit Neutrophil Extracellular Trap-Mediated Defective Efferocytosis in Atherosclerosis

Umesh Kumar Dhawan et al. Circ Res. .

Abstract

Background: Neutrophil extracellular traps (NETs) contribute to atherosclerosis progression and are linked to adverse clinical outcomes such as myocardial infarction and stroke. Although the triggers of NET formation in plaques are known, the mechanisms governing DNase-mediated NET clearance and how these are disrupted during atherosclerosis remain unclear. Moreover, the consequences of impaired NET clearance on disease progression are not known.

Methods: Low-density lipoprotein receptor knockout (Ldlr-/-) mice with hematopoietic cell-specific deletion of DNase1 and DNase1L3 were fed a Western-type diet for 16 weeks to examine the impact of loss of DNase activity and the subsequent NET accumulation on advanced atherosclerosis. The effect of NETs on macrophage efferocytosis was examined in vitro and in the mouse peritoneal cavity and atherosclerotic plaque in vivo. To identify the signaling pathway impairing the NET-induced DNase response, in vitro assays were performed using selective endoplasmic reticulum stress pathway inhibitors, and the findings were validated in murine and human atherosclerotic tissues.

Results: Lack of DNase secretion by macrophages led to accumulation of NETs in local tissues, including atherosclerotic plaques. Persisting NETs in turn promoted cleavage of the efferocytosis receptor MerTK (c-mer proto-oncogene tyrosine kinase), resulting in defective macrophage efferocytosis and increased atherosclerotic plaque necrosis. In vitro screening identified endoplasmic reticulum stress-induced activation of the PERK (protein kinase R-like endoplasmic reticulum kinase)-ATF (activating transcription factor) 4 signaling axis in atherogenic macrophages as a key driver of impaired DNase secretion, leading to delayed NET clearance and their pathological persistence. Treatment of human atherosclerotic plaques and Ldlr-/- mice with integrated stress response inhibitor, a selective PERK inhibitor, restored vascular DNase secretion and facilitated NET clearance.

Conclusions: Macrophages play a key role in clearing NETs from tissues. Endoplasmic reticulum stress suppresses macrophage DNase secretion, leading to NET accumulation in atherosclerotic plaques, which triggers efferocytosis impairment and plaque progression. Targeting the PERK-ATF4 axis to restore DNase release and NET clearance represents a promising therapeutic strategy to promote plaque stabilization.

Keywords: atherosclerosis; efferocytosis; endoplasmic reticulum stress; extracellular traps; macrophages; neutrophils.


Conflict of interest statement

None.

Figures
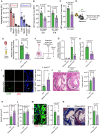
Figure 1.
Figure 1.
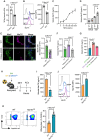
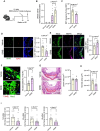
DNase deficiency in hematopoietic cells impairs neutrophil extracellular trap (NET) clearance in atherosclerotic plaques. A, The relative levels of DNase1 and DNase1L3 in lesional macrophages (Mac2+), smooth muscle cells (sm-actin [smooth muscle actin]+), and endothelial cells (CD31+) were quantified by measuring DNase1 and DNase1L3 fluorescence intensity in antibody-labeled aortic root sections of 16-week Western diet–fed Ldlr−/− mice. B, Bone marrow–derived macrophages (BMDMs) from wild-type (WT) and Dnase1−/−Dnase1l3−/− (double knockout [DKO]) mice were exposed to NETs (250 ng/mL) for either 2 or 6 hours. The quantity of remaining NETs in the supernatant was measured by Picogreen assay, and the NET clearance efficiency was determined relative to input NET concentration. C, BMDMs from WT and DKO mice were incubated for 2 hours with pHrodo-red labeled NETs. After washes, fluorescence microscopy was performed, and the percentage of macrophages that showed engulfment of fluorescent NETs was quantified. D, Eight-week-old female Ldlr−/− mice were lethally irradiated followed by administration of bone marrow cells from either WT or DKO mice. Six weeks postbone marrow reconstitution, WT and hematopoietic cell–specific DNase1/DNase1L3 knockout (DNase-HCKO) mice were fed a Western-type diet for 16 weeks and then euthanized for analysis. E, Brachiocephalic artery from WT and DNase-HCKO mice were homogenized, and the tissue extract was analyzed for DNase activity by single radial enzyme diffusion assay. n=10 mice per group. F, Aortic tree from both groups of mice (n=5) were harvested, fragmented, and maintained in culture as explants, followed by exposure to vehicle or NETs for 4 hours. The supernatant was collected for measurement of (G) DNase activity and (H) NET clearance efficiency. I, Lesional NET level was quantified by immunostaining for MPO (myeloperoxidase) and citrullinated histone H3 (Cit-H3) in DAPI (4′,6-diamidino-2-phenylindole)–stained aortic root sections of WT and DNase-HCKO mice. n=10 mice per group. Scale bar, 50 µm. J, Hematoxylin and eosin–stained aortic root sections were analyzed for total atherosclerotic lesion area, (K) necrotic area, and (L) plaque necrosis as a percentage of total lesion area. The regions of plaque necrosis are demarcated by the black dashed line. n=10 to 11 mice per group. Scale bar, 50 µm. M, In situ efferocytosis assay in aortic root sections labeled with terminal deoxynucleotidyl transferase dUTP nick-end labeling (TUNEL) reagent to detect apoptotic cells (ACs; red) followed by Mac2 immunolabelling (green) to identify lesional macrophages. Lesional efferocytosis efficiency was calculated as the ratio of macrophage-associated ACs to free-lying ACs. White arrows indicate ACs associated with macrophages, whereas white arrowheads show free-lying TUNEL+ cells. n=10 mice per group. Scale bar, 25 µm. N, Quantification of lesional collagen content in Mason’s trichrome-stained aortic root sections. n=10 mice per group. Scale bar, 50 µm. All data are represented as mean±SEM. Test for normality was conducted by the Shapiro-Wilk test. P value was determined by the Mann-Whitney U test (B, C, E, G, and H), or unpaired t test (I through N). AU indicates arbitrary units; Mφ, macrophage; ND, not detected; and S.N., supernatant.
Figure 2.
Figure 2.
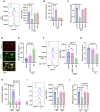
Impaired neutrophil extracellular trap (NET) clearance promotes defective macrophage efferocytosis. A, Bone marrow–derived macrophages (BMDMs) were treated with vehicle or NETs at indicated concentrations for 2 hours, followed by incubation with fluorescently labeled apoptotic cells (ACs) for 1 hour. Efferocytosis efficiency was quantified by fluorescence microscopy and expressed as a percentage decrease relative to the vehicle group. n=4 biological replicates. B, Wild-type (WT) and double knockout (DKO) BMDMs were exposed to vehicle or NETs (250 ng/mL) for 2 hours, then incubated with ACs for 1 hour. Efferocytosis efficiency is shown as a percentage change relative to the vehicle group. n=5 biological replicates. C, Eight-week-old female C57BL/6J mice were lethally irradiated, followed by injection of bone marrow cells from either WT or DKO mice. Six weeks posttransplant, WT and hematopoietic cell–specific DNase1/DNase1L3 knockout (DNase-HCKO) mice were injected intraperitoneally with NETs. A subgroup of DNase-HCKO mice also received purified DNase1 with NETs. Two hours later, CellVue Claret-labeled ACs were injected intraperitoneally. Mice were euthanized 1 hour later, and peritoneal lavage was analyzed for (D) DNase activity by single radial enzyme diffusion, (E) NET levels by picogreen assay, and (F) macrophage efferocytosis efficiency by flow cytometry. n=5 mice per group. G, WT, and DNase-HCKO chimeric mice were generated as above. WT mice received adoptive transfer of WT macrophages, whereas DNase-HCKO mice received WT or DKO macrophages. Sixteen hours after adoptive cell transfer, the mice were injected with NETs followed by ACs as described above for the measurement of peritoneal lavage (H) DNase activity, (I) NET levels, and (J) efferocytosis efficiency. n=5 mice per group. The data are represented as mean±SEM. P values were calculated using Mann-Whitney U test (B, D, and E) and Kruskal-Wallis test with Dunn multiple comparisons correction (F, H through J). Mφ indicates macrophage.
Figure 3.
Figure 3.
Neutrophil extracellular traps (NETs) cleave MerTK to impair efferocytosis. A, bone marrow–derived macrophages (BMDMs) were exposed to NETs (250 ng/mL), then incubated with cytochalasin D (1 µmol/L) for 30 minutes, followed by the addition of fluorescently labeled apoptotic cells (ACs). After washes, AC-binding efficiency was quantified by fluorescence microscopy. n=5 biological replicates. B, Quantification of cell surface MerTK levels in BMDMs treated with or without NETs for 2 hours. n=5 biological replicates. C, ELISA-based measurement of soluble MerTK in the cell culture supernatants of BMDMs exposed for 2 hours with indicated concentrations of NETs. n=3 biological replicates. D, Quantification of soluble MerTK in the cell culture supernatant of wild-type (WT) and double knockout (DKO) BMDMs exposed to vehicle or NETs (250 ng/mL) for 2 hours. n=4 biological replicates. E, Quantification of MerTK levels in lesional macrophages (Mac2+) by immunostaining of aortic root sections of 16-week Western diet–fed bone marrow chimeric WT and hematopoietic cell–specific DNase1/DNase1L3 knockout (DNase-HCKO) Ldlr−/− mice. n=10 mice per group. F, ELISA-based analysis of soluble MerTK levels in the peritoneal lavage of bone marrow chimeric WT and DNase-HCKO mice 2 hours after intraperitoneal injection of NETs without or with DNase1. n=5 mice per group. G, As mentioned above, except that WT and DNase-HCKO mice were adoptively transferred either WT or DKO macrophages intraperitoneally 16 hours before injection of NETs. n=5 mice per group. H, Eight-week-old male C57BL/6J mice were lethally irradiated and injected with bone marrow cells from either WT or MerTK cleavage–resistant (MerTKCR) male mice. Six weeks later, bone marrow chimeric mice were injected with NETs (1 µg IP) and fluorescently labeled ACs 2 hours later. Peritoneal lavage was performed 1 hour later for analysis of (I) soluble MerTK by ELISA; (J) macrophage MerTK expression by flow cytometry, and (K) macrophage efferocytosis efficiency by flow cytometry. n=5 mice per group. The data are represented as mean±SEM. Data were tested for normal distribution using the Shapiro-Wilk test. P values were calculated using the Mann-Whitney U test (A, B, E, I through K) and the Kruskal-Wallis test with Dunn multiple comparisons correction (D, F, and G). Mφ indicates macrophage; and MFI, median fluorescence intensity.
Figure 4.
Figure 4.
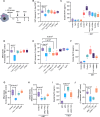
Neutrophil extracellular trap (NET)–associated HMGB1 (high-mobility group box 1) triggers MerTK cleavage by TLR4-mediated activation of ADAM17 (a disintegrin and metalloproteinase 17). A, Bone marrow–derived macrophages (BMDMs) were pretreated with TAPI-0 (10 µmol/L) or vehicle for 1 hour and then exposed to NETs for 2 hours. The cell surface MerTK levels were quantified by flow cytometry. n=6 biological replicates. B, As mentioned above, except that the culture supernatant was assayed by ELISA for soluble MerTK. n=6 biological replicates. C, Similar to A, except that TAPI-0 and NET-exposed BMDMs were incubated with fluorescently labeled apoptotic cells, and the quantification of efferocytosis efficiency was performed by microscopy. n=5 biological replicates. D, In vitro generated NETs were immunostained with anti–citrullinated histone H3 (CitH3) and anti-HMGB1 antibody and imaged by fluorescence microscopy. Nuclei were stained with DAPI (4′,6-diamidino-2-phenylindole). Scale bar, 50 µm. E, BMDMs were exposed to NETs in the presence of a HMGB1 neutralizing Ab (nAb) or control IgG. Soluble MerTK was measured in the culture supernatants. n=6 biological replicates. F, Similar to E, except that cell surface MerTK expression was quantified by flow cytometry. n=6 biological replicates. G, Efferocytosis efficiency was measured in BMDMs exposed to NETs in the presence of control IgG or HMGB1 nAb. n=6 biological replicates. H, Wild-type (WT) or Tlr4−/− BMDMs were exposed to NETs, followed by quantification of soluble MerTK levels in the supernatant, and (I) MerTK expression on the cell surface. n=6 biological replicates. J, Quantification of efferocytosis in WT and Tlr4−/− BMDMs exposed to vehicle or NETs. n=6 biological replicates. The data are represented as mean±SEM. P values were calculated using the Kruskal-Wallis test with Dunn multiple comparisons correction (A through C and E through G) or Aligned Rank Transform ANOVA (H through J). Ab indicates antibody; MFI, median fluorescence intensity; TAPI, TNF-α protease inhibitor; TLR, toll-like receptor; and Veh, vehicle.
Figure 5.
Figure 5.
ATF (activating transcription factor) 4 signaling in atherogenic macrophages impairs neutrophil extracellular trap (NET)–induced DNase response. A, Bone marrow–derived macrophages (BMDMs) were incubated with 7-ketocholesterol (7-KC, 15 µmol/L) in the absence or presence of tauroursodeoxycholic acid (TUDCA; 3 mmol/L) or 4-phenylbutyric acid (4-PBA; 0.5 μM) for 18 hours. NETs (250 ng/mL), followed by fluorescently labeled apoptotic cells (ACs), were added to the culture. The supernatant was used for analysis of (B) DNase activity as a function of NET clearance by picogreen assay, and (C) soluble MerTK levels by ELISA, whereas the cells were used for (D) quantification of efferocytosis efficiency by fluorescence microscopy. n=6 biological replicates. E, BMDMs were incubated with 7-KC (15 µmol/L) along with either vehicle, integrated stress response inhibitor (ISRIB; 3 mmol/L), Ceapin A7 (1µM), or 4µ8C (100 µmol/L), for 18 hours, followed by exposure to NETs for 2 hours. The NET clearance efficiency was measured by the Picogreen assay in the supernatant. n=6 biological replicates. F, Quantification of soluble MerTK in the supernatants of vehicle or NET-exposed BMDMs pretreated with 7-KC in the absence or presence of ISRIB. n=6 biological replicates. G, Quantification of efferocytosis efficiency in vehicle or NET-exposed BMDMs pretreated with 7-KC in the absence or presence of ISRIB. n=6 biological replicates. H, BMDMs transfected with negative control siRNA (siNC) or ATF4 siRNA (siAtf4) were incubated with vehicle or 7-KC as indicated, followed by exposure to NETs for the measurement of DNase activity, and (I) soluble MerTK levels in the supernatant. n=6 biological replicates. J, Similar to H, except that NET-exposed macrophages were incubated with ACs for the quantification of efferocytosis efficiency. n=6 biological replicates. The data are represented as mean±SEM. P values were calculated using the Kruskal-Wallis test with Dunn multiple comparisons correction (B through J). ER indicates endoplasmic reticulum. Mφ indicates macrophage; siRNA, silencing RNA; and 4μ8C, 7-hydroxy-4-methyl-2-oxo-2H-1-benzopyran-8-carboxaldehyde.
Figure 6.
Figure 6.
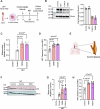
Integrated stress response inhibitor (ISRIB) increases neutrophil extracellular trap (NET)–induced DNase response in mouse and human atherosclerotic plaques. A, Aorta harvested from 16-week Western diet (WD)–fed Ldlr−/− mice were cultured as explants and treated with either vehicle, tauroursodeoxycholic acid (TUDCA), or ISRIB (3 mmol/L) for 18 hours, followed by exposure to NETs for 4 hours. Tissue lysates were used for (B) immunoblotting of ATF (activating transcription factor) 4, whereas the culture supernatant was tested for (C) DNase activity and (D) NET clearance efficiency. n=4 mice per group. E through H, Similar to (A through D), except that human carotid endarterectomy tissues were treated with vehicle, TUDCA, or ISRIB, followed by exposure to NETs for analysis of (F) tissue ATF4 levels by immunoblotting; (G) DNase activity, and (H) NET clearance efficiency in the culture supernatant. n=5. The data are represented as mean±SEM. P values were calculated using the Kruskal-Wallis test with Dunn multiple comparisons correction (C, D, G, and H). WT indicates wild-type.
Figure 7.
Figure 7.
Integrated stress response inhibitor (ISRIB) enhances vascular DNase activity and neutrophil extracellular trap (NET) clearance in murine atherosclerosis. A, Ten-week-old female Ldlr−/− mice were fed a Western diet (WD) for 16 weeks. During the final 4 weeks, one group of mice received ISRIB (1 mg/kg IP) daily, whereas the other group received vehicle. B, Aortic explants from vehicle and ISRIB-treated mice were exposed to NETs for measurement of DNase activity, and (C) NET clearance efficiency, in the supernatants. D, Aortic root sections were immunostained with anti-MPO (myeloperoxidase) and anticitrullinated histone H3 (CitH3) antibody for quantification of lesional NET levels, or (E) MerTK levels in lesional Mac2+ macrophages. F, Aortic root sections were labeled with terminal deoxynucleotidyl transferase dUTP nick-end labeling (TUNEL; red) and immunostained with anti-Mac2 antibody (green) for measurement of lesional in situ efferocytosis efficiency as a ratio of macrophage-associated apoptotic cells (ACs):free-lying ACs. White arrows indicate TUNEL+ ACs associated with a macrophage. White arrowheads show free-lying TUNEL+ cells. G, Hematoxylin and eosin–stained aortic root sections were used for quantification of total lesion area, and (H) necrotic area, in vehicle and ISRIB-treated mice. The necrotic regions are demarcated by the red dashed lines. I, Quantitative polymerase chain reaction–based analysis of Tnf, Il1b, and Il6, in vascular tissues obtained from vehicle and ISRIB-treated mice. n=10 mice per group. The data are represented as mean±SEM. Data were tested for normal distribution using Shapiro-Wilk test. P values were calculated using unpaired t test (B through F, and H), Mann-Whitney U test (G and I). AC indicates apoptotic cell; MFI, median fluorescence intensity; Mφ, macrophage; and ND, not detected.

Comment in

References

    1. Martin SS, Aday AW, Almarzooq ZI, Anderson CAM, Arora P, Avery CL, Baker-Smith CM, Barone Gibbs B, Beaton AZ, Boehme AK, et al. ; American Heart Association Council on Epidemiology and Prevention Statistics Committee and Stroke Statistics Subcommittee. 2024 heart disease and stroke statistics: a report of US and global data from the American Heart Association. Circulation. 2024;149:e347–e913. doi: 10.1161/CIR.0000000000001209 - PMC - PubMed
    1. Vaduganathan M, Mensah GA, Turco JV, Fuster V, Roth GA. The global burden of cardiovascular diseases and risk: a compass for future health. J Am Coll Cardiol. 2022;80:2361–2371. doi: 10.1016/j.jacc.2022.11.005 - PubMed
    1. Ridker PM. Residual inflammatory risk: addressing the obverse side of the atherosclerosis prevention coin. Eur Heart J. 2016;37:1720–1722. doi: 10.1093/eurheartj/ehw024 - PubMed
    1. Doran AC, Yurdagul A, Jr, Tabas I. Efferocytosis in health and disease. Nat Rev Immunol. 2020;20:254–267. doi: 10.1038/s41577-019-0240-6 - PMC - PubMed
    1. Kasikara C, Doran AC, Cai B, Tabas I. The role of non-resolving inflammation in atherosclerosis. J Clin Invest. 2018;128:2713–2723. doi: 10.1172/JCI97950 - PMC - PubMed

MeSH terms