. 2025 Oct 1;135(19):e186143.
doi: 10.1172/JCI186143.

Urine proteins reveal distinct coagulation and complement cascades underlying acute versus chronic lupus nephritis

Affiliations

Urine proteins reveal distinct coagulation and complement cascades underlying acute versus chronic lupus nephritis

Ting Zhang et al. J Clin Invest. .

Abstract

The current gold standard for assessing renal pathology in lupus nephritis (LN) is invasive and cannot be serially repeated. To assess if urine can serve as a liquid biopsy for underlying renal pathology, urine obtained from patients with LN at the time of renal biopsy were interrogated for 1,317 proteins, using an aptamer-based proteomic screen. Levels of 57 urine proteins were significantly elevated and correlated with pathology activity index (AI), notably endocapillary hypercellularity, fibrinoid necrosis, and cellular crescents. These included proteins pertaining to leukocyte/podocyte activation, neutrophil activation, endothelial activation, and markers of inflammation/anti-inflammation. In contrast, complement and coagulation cascade proteins, and proteins related to the extracellular matrix (ECM) emerged as the strongest urinary readouts of concurrent renal pathology chonicity index (CI), notably tubular atrophy and interstitial fibrosis. In vitro mechanistic studies revealed that complement proteins C3a and C5a increased the expression of profibrotic ECM proteins in macrophages and proximal tubule epithelial cells. Thus, carefully assembled panels of urinary proteins that are indicative of high renal pathology AI and/or CI may help monitor the status of renal pathology after therapy in patients with LN, in a noninvasive manner, without the need for repeat renal biopsies.

Keywords: Autoimmunity; Coagulation; Complement; Immunology; Lupus.


Conflict of interest statement

Conflict of interest: The authors have declared that no conflict of interest exists.

Figures

Figure 1
Figure 1. Proteins elevated in urine samples of patients with LN with high renal pathology AI.
(A) A volcano plot representation of all 1,317 proteins assayed in the aptamer-based screen. Log-transformed data were used for the analysis. In total, 64 proteins were identified as being significantly upregulated with an FC of greater than 2 and a P value of less than 0.05 (red dots). An additional 22 proteins were identified as being significantly downregulated, with a FC of less than 0.5 and a P value of less than 0.05 (blue dots). Among the 64 upregulated proteins, 57 proteins (high-AI proteins, or Hi.AI in the figure) had the strongest Spearman correlation with renal pathology AI (r > 0.6); all these proteins also had ROC AUC values of greater than 0.775 when comparing patients with LN with Hi.AI with patients with LN with non-Hi.AI. (B) A PCA plot of the 57 significantly elevated proteins in participants with Hi.AI (FC > 2; P < 0.05; Spearman’s r > 0.6 with AI). The principal components (PCs) are displayed on each axis of the plot. Concentration ellipses encompass each subject group, color coded as indicated. (CE) The 57 proteins from the aptamer-based screen whose levels were elevated in participants with Hi.AI with a FC of greater than 2, a P value of less than 0.05, and a Spearman’s r of greater than 0.6 with AI were used for GO and KEGG pathway enrichment analyses. The implicated top 10 KEGG pathways (C), biological processes (D), and molecular functions (E) identified using the Database for Annotation, Visualization and Integrated Discovery (DAVID) are displayed. Each annotation was identified by P value significance and are ordered by the protein ratio percentage within that annotation term. The color of each annotation dot is representative of the –log10FDR value, and the size corresponds to the number of proteins belonging to the annotation term. (F) The Cytoscape stringAPP was used to create protein-protein interaction networks for the significantly elevated proteins in participants with Hi.AI (FC > 2, P < 0.05, and Spearman’s r > 0.6 with AI). MCODE clustering identified the highly interconnected nodes in the networks. The colors are continuously mapped and increasing FC corresponds to a deeper red color.
Figure 2
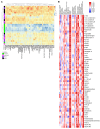
Figure 2. Correlation of high-AI urine proteins with renal pathology and clinical parameters.
(A) A heatmap representation of the 57 significantly upregulated proteins from the aptamer-based screen elevated in individuals with Hi.AI (P < 0.05, Mann-Whitney U test; FC > 2; Spearman’s r > 0.6 with AI). Proteins are clustered hierarchically. Each row represents a study participant. Each column represents a Cr-normalized protein-level expression. Proteins expressed above the mean are shaded red, those comparable to the mean are shaded yellow, and those below the mean are shaded blue. Subject groupings are color coded as indicated. Note: Two patients had high AI and CI (both were classified under “Hi.AI” in this plot). (B) Spearman’s correlation heatmap displaying correlations among the top 57 proteins elevated in participants with Hi.AI and the participants’ clinical metrics as well as their concurrent renal pathology features including CI and its 4 component attributes (glomerulosclerosis, fibrous crescents, tubular atrophy, interstitial fibrosis) and AI and its 6 component attributes (endocapillary hypercellularity, neutrophils/karyorrhexis, hyaline deposits, interstitial inflammation, fibrinoid necrosis, and cellular crescents). *P < 0.05, **P < 0.01, ***P < 0.001, and ****P < 0.0001.
Figure 3
Figure 3. Top discriminatory urine proteins identifying patients with LN with high renal pathology AI.
(A) The 57 significantly elevated proteins in participants with Hi.AI (FC > 2, P < 0.05; Spearman’s t > 0.6 with AI) were subjected to protein-protein correlation analysis. Hierarchical clustering was performed. Dark blue corresponds to a positive correlation between protein pairs. The correlation cluster labeled “1” encompasses multiple signaling proteins critical for the activation of immune cells. Cluster 2 represents a neutrophil signature cluster and the cluster labeled “3” encompasses several anti-inflammatory proteins. (B) An ROC AUC plot of the top 10 proteins from the aptamer-based screen based solely on ROC AUC values discriminating participants with Hi.AI from all other patients with LN. TPR, true positive rate; FPR, false positive rate. (C) RFA shown are the 10 most discriminatory proteins for the identification of participants with Hi.AI. The proteins are ordered by their importance in discrimination, displayed as the Gini coefficient. (D) STEM analysis was executed for the top 57 proteins (FC > 2; P < 0.05; Spearman’s t > 0.6 with AI). Protein expression through increasing AI are plotted. Statistically significant profiles that are similar form a cluster of profiles and are shaded the same color. A total of 10 profiles (each representing a different temporal pattern) were generated by STEM analysis, of which only the statistically significant profiles are displayed. The number in the upper left-hand corner of each box is the number of proteins in each profile. The number in the lower left-hand corner is the P value significance of the number of proteins assigned to each profile relative to the expected number, based upon random permutation testing.
Figure 4
Figure 4. Proteins elevated in urine samples of patients with LN with high renal pathology CI.
(A) A volcano plot representation of all 1,317 proteins assayed in the aptamer-based screen; log-transformed data were used for analysis. In total, 112 proteins were significantly upregulated with an FC < 0.5 and P < 0.05. Of the 112 elevated proteins, 50 had a Spearman’s r > 0.6 with concurrent renal pathology CI (here, abbreviated CI). All these proteins had ROC AUC values of greater than 0.8, comparing patients with high CI with other patients with lupus. (B) A PCA plot of the 50 significantly elevated proteins in participants with high CI (FC > 2; P < 0.05; Spearman’s r > 0.6 with CI), with principal components (PCs) displayed on each axis. Concentration ellipses encompass each subject group, color coded as indicated. (CE) The 50 proteins from the aptamer-based screen whose levels were elevated in individuals with high CI (FC > 2; P < 0.05; Spearman’s r > 0.6 with CI) were used for GO and KEGG pathway enrichment analysis. The implicated top 10 KEGG pathways (C), biological processes (D), and molecular functions (E) identified using the Database for Annotation, Visualization and Integrated Discovery are displayed. Annotation details are as listed in Figure 1. (F) The Cytoscape stringAPP was used to create protein-protein interaction networks for the significantly elevated proteins in individuals with high CI (FC > 2; P < 0.05; Spearman’s r > 0.6 with CI). Annotation details are as listed in Figure 1. Reactome pathways implicated include 2 dominant clusters: cluster 1, including formation of fibrin clot (clotting cascade) and hemostasis; and cluster 2, including complement cascade initial triggering of complement, and activation of C3 and C5.
Figure 5
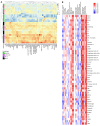
Figure 5. Correlation of high CI urine proteins with LN pathology and clinical parameters.
(A) A heatmap representation of the 50 significantly upregulated proteins from the aptamer-based screen elevated in individuals with Hi.CI (P < 0.05 by Mann-Whitney U test; FC > 2; Spearman’s r > 0.6 with CI). Annotation details are listed in Figure 2. Note: Two patients had Hi.AI and high CI (Hi.CI); both were classified under “Hi.CI” in this plot. (B) A Spearman correlation heatmap displaying correlations among the top 50 proteins elevated in individuals with Hi.CI and the participants’ clinical metrics, as well as their concurrent renal pathology features, as detailed in Figure 2. GFR, glomerular filtration rate. *P < 0.05, **P < 0.01, ***P < 0.001, and ****P < 0.0001.
Figure 6
Figure 6. Top discriminatory proteins identifying patients with LN with high renal pathology CI.
(A) The 50 significantly elevated proteins in participants with a high CI (FC > 2; P < 0.05; and Spearman’s r > 0.6 with CI) were subjected to protein-protein correlation analysis. Shown is a correlation plot displaying all significant Pearson’s correlations (P < 0.05) among these proteins. Hierarchical clustering was performed. Dark blue corresponds to a positive correlation between protein pairs. (B) An ROC AUC plot of the top 10 proteins from the aptamer-based screen based on ROC AUC values discriminating participants with a high CI from all other patients with LN. AUC values were calculated using the Delong method with a 95% confidence level. The proteins and their AUC value are differentiated by color. (C) The 50 proteins with significantly elevated levels in participants with a high CI (FC > 2; P < 0.05; Spearman’s r > 0.6 with CI) were subjected to RFA, and the 10 proteins’ most discriminatory of high CI are indicated, ordered by their Gini coefficients. (D) STEM analysis was executed for the 50 proteins implicated (FC > 2; P < 0.05; Spearman r > 0.6 with CI) to identify urine proteins that increase progressively with worsening CI scores. Annotation details are as listed in Figure 3. A total of 8 profiles or clusters (each representing a different temporal pattern) were generated by STEM analysis, of which only the statistically significant clusters are displayed.
Figure 7
Figure 7. Coagulation and complement proteins associated with LN pathology.
(A) The blood coagulation cascade, highlighting molecules whose levels in urine are significantly correlated with renal pathology AI (blue font), CI (CI) (red font), or both (purple font) in LN. Other proteins are listed in black font (interrogated but not significantly changed) or grey font (not interrogated by the proteomic screen). Uninterrupted arrows indicate activation, and interrupted arrows signify inhibition or cleavage of downstream protein or substrate. The yellow bubbles highlight only proteins significantly elevated in LN with high-CI versus low-CI (FC ≥ 2; P < 0.05) or higher in CI than in AI by at least 10%. The pink bubbles highlight proteins whose levels were significantly elevated only in patients with LN with high-AI versus low-AI (FC ≥ 2; P < 0.05) or higher in AI than in CI by at least 10% (in terms of correlation coefficient or FC). Also shown is a Spearman correlation heatmap displaying correlations among the 27 coagulation-related proteins and renal pathology metrics. *P < 0.05, **P < 0.01, ***P < 0.001, and ****P < 0.0001. (B) The complement activation pathway highlighting molecules whose levels in urine are significantly elevated with AI, CI, or both. See A for other annotation details. Also shown is a Spearman correlation heatmap displaying correlations among the 32 complement related proteins and their paired renal pathology metrics, as detailed in A. α2-AP, MG, α2-antiplasmin, α2-macroglobulin; APC, activated protein C; AT, antithrombin; B, factor B; BK, bradykinin; C1 INH, C1 esterase inhibitor; C4BP, C4 binding protein; CL-K1, collectin kidney 1; D, factor D; DAF, decay-accelerating factor; FDP, fibrin degradation products; H, factor H; I, factor I; MAP-1, MBL/ficolin-associated protein 1; MASP, mannan-binding lectin-associated serine protease; MBL, mannose-binding lectin; MCP, membrane cofactor protein; P, properdin; PK, prekallikrein; sMAP, small MBL-associated protein; TM, thrombomodulin; tPA, tissue plasminogen activator; uPA, urokinase.
Figure 8
Figure 8. Complement C3a and C5a trigger the expression of ECM proteins in macrophages and proximal tubule cells.
(A) Shown are representative fields from 3 independent experiments. Complement proteins C3a and C5a increased the expression of ECM proteins in THP1 macrophages, BMDMs, and HK2 proximal tubule cells after 72 hours of treatment in serum-free medium. Scale bars: 50 μm. (BD) The scatter plots show the mean staining intensity per THP-1 macrophage (B), BMDM (C), and HK2 proximal tubule cell (D), normalized to expression levels in their respective vehicle-treated groups. Each data point corresponds to quantified fluorescence intensity in a single field of view (FOV) from the microscope, and the larger dots represent the average of FOVs in biological replicates, each of which is color coded. RT-qPCR analysis of ECM protein coding genes were measured in BMDMs (E) and in HK2 proximal tubule cells (F). Gene expression was normalized to the expression of 18S ribosomal RNA in the same sample and then normalized to the expression level of vehicle-treated group (n = 4). *P < 0.05, **P < 0.01, and ***P < 0.001 by 2-tailed Student’s t test.
Figure 9
Figure 9. The biphasic role of complement proteins in driving renal pathology activity and chronicity in LN.
Circulating immune complexes and Abs planted directly within glomerular and tubulo-interstitial regions of the kidneys may fix complement, resulting in complement activation. The alternative pathway may further amplify complement activation within the kidneys. The products of C3 and C5 convertases, including the anaphylatoxins C3a and C5a, engage cognate receptors on a wide spectrum of immune cells, leading to immune cell activation, release of cytokines and chemokines, and acute inflammation, leading to high AI, as depicted on the left. Long-standing, unresolved complement activation and eventual formation of MAC may additionally engage and activate more immune and renal-resident cells, leading to tissue damage and repair, ECM deposition, and renal fibrosis, leading to high CI, as depicted on the right.

References

    1. Kostopoulou M, et al. Annals of the Rheumatic Diseases collection on lupus nephritis (2019-2022): novel insights and advances in therapy. Ann Rheum Dis. 2023;82(6):729–733. doi: 10.1136/ard-2023-223880. - DOI - PubMed
    1. Parikh SV, et al. Update on lupus nephritis: core curriculum 2020. Am J Kidney Dis. 2020;76(2):265–281. doi: 10.1053/j.ajkd.2019.10.017. - DOI - PubMed
    1. Bajema IM, et al. Revision of the International Society of Nephrology/Renal Pathology Society classification for lupus nephritis: clarification of definitions, and modified National Institutes of Health activity and chronicity indices. Kidney Int. 2018;93(4):789–796. doi: 10.1016/j.kint.2017.11.023. - DOI - PubMed
    1. Moroni G, et al. Changing patterns in clinical-histological presentation and renal outcome over the last five decades in a cohort of 499 patients with lupus nephritis. Ann Rheum Dis. 2018;77(9):1318–1325. doi: 10.1136/annrheumdis-2017-212732. - DOI - PubMed
    1. Moroni G, et al. Predictors of increase in CI and of kidney function impairment at repeat biopsy in lupus nephritis. Lupus Sci Med. 2022;9(1):e000721. doi: 10.1136/lupus-2022-000721. - DOI - PMC - PubMed