. 2025 Aug 15;135(19):e190369.
doi: 10.1172/JCI190369. eCollection 2025 Oct 1.

Pharmacological targeting of the IL-17/neutrophil axis attenuates calcific deposits in rat models of calciphylaxis

Affiliations

Pharmacological targeting of the IL-17/neutrophil axis attenuates calcific deposits in rat models of calciphylaxis

Bo Tao et al. J Clin Invest. .

Abstract

Calciphylaxis is a rare but life-threatening disorder characterized by ectopic calcification affecting the subcutaneous tissues and blood vessels of the skin. Survival rates are less than a year after diagnosis, and yet despite the severity of the condition, the pathobiology of calciphylaxis is ill understood. Here, we created animal models of calciphylaxis that recapitulated many characteristics of the human phenotype. We demonstrate that cutaneous calcification is preceded by inflammatory cell infiltration. We show that increased local skin inflammation, regardless of the inciting cause, in the presence of hypercalcemia and hyperphosphatemia contributes to cutaneous ectopic calcification. Genetically modified rodents lacking immune activation of T and B cells or NK cells are resistant to developing cutaneous calcification. Consistent with this, administration of the immunosuppressive cyclophosphamide reduced calcific deposits, as did T cell suppression with cyclosporine. We demonstrate that IL-17 is upregulated in calcific skin and neutrophils are the predominant cell type expressing IL-17 and tissue-nonspecific alkaline phosphatase (TNAP) that are necessary for ectopic calcification. Targeting IL-17 with a monoclonal antibody or using a myeloperoxidase inhibitor to blunt neutrophil activation notably attenuated calcific deposits in vivo. Taken together, these observations provide fresh insight into the role of the immune system and the IL-17/neutrophil axis in mediating ectopic calcification in rodent models of calciphylaxis.

Keywords: Bone disease; Cell biology; Dermatology; Neutrophils; Skin.


Figures
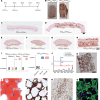
Figure 1
Figure 1. A rodent model of ectopic cutaneous calcification.
(A) Sprague-Dawley rats were sensitized with dihydrotachysterol (DHT; 10 mg/kg, orally [p.o.]) and challenged with FeCl3 (25 μg/20 μL, s.c.) to induce ectopic tissue calcification in dorsal skin. (B) Gross anatomy of harvested dorsal skin. Black arrowheads indicate regions of ectopic mineralization in the dermal tissue. (C and D) Von Kossa staining of rat dermal tissue sensitized with DHT and injected with H2O (C) or FeCl3 (D). (Black arrowheads point to calcified regions. n = 4 animals per group.) Scale bar: 0.5 mm. (EH) Alizarin red staining of rat dermal biopsies (4 mm). (E) Vehicle p.o. + H2O s.c. (F) Vehicle p.o. + FeCl3 s.c. (G) DHT p.o. + H2O s.c. (H) DHT p.o. + FeCl3 s.c. (Black arrowheads point to calcified regions. n = 4 animals per group.) Scale bar: 0.5 mm. (I) Quantitative analysis of site of von Kossa staining–positive regions in rat skin (DHT p.o. + FeCl3 s.c.: n = 20 animals, 20 sites; subcutis: 20/20; dermis: 19/20; epidermis: 0/20; DHT p.o. + H2O s.c.: n = 20 animals, 20 sites; subcutis: 0/20; dermis: 3/20; epidermis: 0/20). (J and K) Raman spectroscopy analysis of hydroxyapatite and calcified and non-calcified dermal tissue, with representative von Kossa–stained dermal tissue used for Raman microscopy. Scale bar: 0.5 mm. (L and M) Assessment of calcific deposits around adipose tissue in calcified dorsal skin using Oil Red O (adipocyte identification) and von Kossa staining (n = 3 animals). (N and O) Histology and immunofluorescent staining of CD31 in calcified regions of skin demonstrated calcific regions (green) in the periendothelial region (red, arrowheads) (representative images, n = 3 animals). Scale bar: 30 μm.
Figure 2
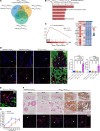
Figure 2. Inflammation is prominent and precedes calcific mineral deposits.
(A) Venn diagram of RNA-Seq results from dermal tissues treated with vehicle p.o. + H2O s.c., DHT p.o. + H2O s.c., vehicle p.o. + FeCl3 s.c., and DHT p.o. + FeCl3 s.c. (n = 3 animals per group). (B) Top 5 Kyoto Encyclopedia of Genes and Genomes (KEGG) pathways associated with differentially expressed genes (DEGs) between DHT p.o. + FeCl3 s.c. and vehicle p.o. + H2O s.c. (n = 3 animals per group). (C) Enrichment score of the IL-17 signaling pathway and the top 16 leading-edge genes in DHT p.o. + FeCl3 s.c. versus vehicle p.o. + H2O s.c. analyzed by gene set enrichment analysis (GSEA). (D) Immunofluorescent staining of CD45 and CD68 in calcified skin regions reveals the presence of CD45 and CD68 (red, arrowheads) localized within the calcified areas (red, arrowheads, CD45/CD68; green, HA,hydroxyapatite) (representative images). Quantification of CD45+ cells and CD68+ cells revealed a robust increase in macrophage infiltration in the DHT+FeCl3 group (n = 5 animals per group). Scale bars: 100 μm. (E) Representative immunofluorescent staining image of CD64 in calcified skin reveals CD64+ cells (red, arrowheads) localized within hydroxyapatite-rich (HA-rich) calcified regions (green) (n = 4 animals). Scale bars: 50 μm. (F) Time-course histological and immunofluorescent staining of CD45 at 30, 48, 72, and 96 hours in DHT-treated rats injected with FeCl3 (n = 6 animals per group). Scale bars: 100 μm. (G) Temporal analysis of von Kossa–positive and CD45-positive cells in rat skin. Data are represented as mean ± SEM. ****P < 0.0001, 2-tailed Student’s t test.
Figure 3
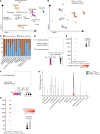
Figure 3. Single-cell RNA-Seq analysis of skin from calcific versus non-calcific tissue.
(A) UMAP representation illustrating distinct cell cluster phenotypes within injured skin (n = 3 animals per group). (B) Distribution of cells from groups treated with DHT p.o. + FeCl3 s.c. and vehicle p.o. + H2O s.c. across these clusters. (C) Proportions of cell types in DHT p.o. + FeCl3 s.c. and vehicle p.o. + H2O s.c. (D) KEGG pathway analysis demonstrating the upregulation of inflammatory pathways in macrophages of DHT p.o. + FeCl3 s.c. versus vehicle p.o. + H2O s.c. (E) Dot plot highlighting DEGs of IL-17 signaling pathway between DHT p.o. + FeCl3 s.c. and vehicle p.o. + H2O s.c. (F) KEGG analysis demonstrating principal pathways upregulated in T cells of DHT p.o. + FeCl3 s.c. versus vehicle p.o. + H2O s.c. (G) Dot plot illustrating DEGs associated with the Th17 cell differentiation pathway in groups treated with DHT p.o. + FeCl3 s.c. and vehicle p.o. + H2O s.c. (H) Violin plot showing TNAP expression in specific cell populations in skin of DHT p.o. + FeCl3 s.c. and vehicle p.o. + H2O s.c.
Figure 4
Figure 4. Administration of sterile inflammation–inducing agents after DHT administration also leads to ectopic calcification.
(A) Experimental scheme of LPS, FeCl3, and zymosan treatment. (B and C) Von Kossa staining of rat dermal tissues to identify calcific regions in controls (B) and animals that received DHT (C) (arrowheads; representative images; n = 3 animals per group). (D and E) Immunofluorescent staining of CD68 in calcified skin regions (red, arrowheads, CD68; green, HA, hydroxyapatite). (D) and quantification of inflammatory infiltrate (E) (representative images; n = 5 animals per group). Scale bar: 100 μm. (F) Top 5 KEGG pathways associated with DEGs between DHT p.o. + LPS s.c. (n = 5 animals) and vehicle p.o. + LPS s.c. (n = 3 animals). (G and H) GSEA analysis of the IL-17 signaling pathway showing enrichment scores (G) and the top 14 leading-edge genes (H) in DHT p.o. + LPS s.c. versus vehicle p.o. + LPS s.c. (I) Venn diagram depicting common DEGs between DHT p.o. + LPS s.c. (n = 5 animals) and vehicle p.o. + LPS s.c. (n = 3 animals) and between DHT p.o. + FeCl3 s.c. (n = 4 animals) and vehicle p.o. + H2O s.c. (n = 3 animals). (J) Shared upregulated pathways between DHT p.o. + LPS s.c. and vehicle p.o. + LPS s.c. and between DHT p.o. + FeCl3 s.c. and vehicle p.o. + H2O s.c. are identified and highlighted. Data are represented as mean ± SEM. ****P < 0.0001, 2-tailed Student’s t test.
Figure 5
Figure 5. Genetic deletion of B, T, and NK cells (SRG rats) inhibits the formation of ectopic calcification.
(A) Experimental scheme comparing the ability of WT and SRG rats treated with DHT p.o. + FeCl3 s.c. to exhibit ectopic cutaneous calcification. (B) Gross images of dermal tissue in WT and SRG rats. Black arrowheads point to calcific regions. (C) Representative von Kossa–stained images highlighting calcified regions in rat dermal tissue. (D) Immunofluorescent staining of CD45+ and CD68+ cells in WT and SRG rat dermal tissue (representative images; n = 6 animals per group). Scale bars: 100 μm. (E) CT scan of rat dermal tissue in WT and SRG rats (arrowheads point to extraskeletal calcification) (WT, n = 4 animals; SRG, n = 6 animals). (F) Quantification of free calcium levels in rat skin dermal tissues (n = 10 animals per group). (G) Assessment of alkaline phosphatase activity in rat dermal tissues (TNAP, tissue-nonspecific alkaline phosphatase) (WT DHT p.o. + FeCl3 s.c.: n = 4 animals; WT vehicle p.o. + H2O s.c.: n = 4 animals; SRG DHT p.o. + FeCl3 s.c.: n = 6 animals; SRG vehicle p.o. + H2O s.c.: n = 3 animals). (H) Upregulated pathways identified in WT versus SRG rats after DHT p.o. + FeCl3 s.c. (n = 4 animals per group). Data are represented as mean ± SEM. **P < 0.01, ***P < 0.001, ****P < 0.0001, 2-tailed Student’s t test.
Figure 6
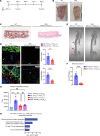
Figure 6. Cyclophosphamide-induced leukopenia rescues ectopic calcification.
(A) Experimental scheme for neutrophil depletion using cyclophosphamide (CPA) in WT rats treated with DHT p.o. + FeCl3 s.c. (B) Comparison of WBC count in PBS- and CPA-treated rats after DHT p.o. + FeCl3 s.c. administration (n = 5 animals per group). (C) Gross images of rat dermal tissue in PBS- and CPA-treated rats. Black arrowheads point to calcific regions. (D) Von Kossa–stained rat dermal tissue highlighting calcification in PBS- and CPA-treated rats given DHT p.o. + FeCl3 s.c. (representative images; arrowheads point to calcific regions; n = 4 animals per group). (E) Immunofluorescent staining of CD68+ cells in PBS- and CPA-treated rats and quantification (representative images; n = 4 animals per group). Scale bar: 100 μm. (F) Immunofluorescent staining of myeloperoxidase (MPO) to identify neutrophils in PBS- and CPA-treated rats and quantification (representative images; n = 4 animals per group). Scale bar: 50 μm. (G) Immunofluorescence staining and quantification of CD3+ T cells in PBS- versus CPA-treated rats (n = 5 animals per group). Scale bar: 50 μm. (H) Alkaline phosphatase activity in rat dermal tissues in PBS- versus CPA-treated animals (n = 5 animals per group). (I) Serum alkaline phosphatase activity in rats treated with PBS or CPA (n = 5 animals per group). (J) Gene Ontology analysis associated with upregulated DEGs in PBS-treated (n = 4 animals) and CPA-treated rats following DHT p.o. + FeCl3 s.c. (n = 5 animals). (K) Enriched genes in immune response–regulating cell surface receptor signaling pathway. Data are represented as mean ± SEM. ***P < 0.001, ****P < 0.0001, 2-tailed Student’s t test.
Figure 7
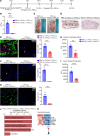
Figure 7. IL-17a blockade prevents skin calcification and inflammation in the DHT+FeCl3–induced rat model.
(A) Immunofluorescence staining and quantification of IL-17a+ cells in skin tissue from rats treated with DHT p.o. + FeCl3 s.c. or vehicle p.o. + H2O s.c. (representative images; n = 5 animals per group). Scale bar: 50 μm. (B) Schematic of the IL-17a mAb experimental timeline. (C) Gross images of dorsal skin lesions. Black arrowheads show visible regions of calcification. (D) Representative von Kossa–stained images of rat dermal tissue highlighting calcified regions (arrowheads). Quantification of calcified percentage in the IL-17a mAb–treated group (n = 12) compared with IgG control (n = 8). (E) Top 5 KEGG pathways enriched in DEGs between IgG-treated (n = 3 animals) and IL-17a mAb–treated rats following DHT p.o. + FeCl3 s.c. (n = 3 animals). (F) Enriched genes in IL-17 signaling pathway. Data are represented as mean ± SEM. ***P < 0.001, 2-tailed Student’s t test.

References

    1. Mormile I, et al. Calcinosis cutis and calciphylaxis in autoimmune connective tissue diseases. Vaccines (Basel) 2023;11(5):898. doi: 10.3390/vaccines11050898. - DOI - PMC - PubMed
    1. Nigwekar SU, et al. Calciphylaxis. N Engl J Med. 2018;379(4):399–400. doi: 10.1056/NEJMc1807324. - DOI - PubMed
    1. Hussein MR, et al. Calciphylaxis cutis: a case report and review of literature. Exp Mol Pathol. 2009;86(2):134–135. doi: 10.1016/j.yexmp.2009.01.008. - DOI - PubMed
    1. Nigwekar SU, et al. Calciphylaxis: risk factors, diagnosis, and treatment. Am J Kidney Dis. 2015;66(1):133–146. doi: 10.1053/j.ajkd.2015.01.034. - DOI - PMC - PubMed
    1. Weenig RH, et al. Calciphylaxis: natural history, risk factor analysis, and outcome. J Am Acad Dermatol. 2007;56(4):569–579. doi: 10.1016/j.jaad.2006.08.065. - DOI - PubMed

MeSH terms