. 2025 Oct 2;10(1):323.
doi: 10.1038/s41392-025-02418-1.

Sodium nitrate protects against metabolic syndrome by sialin-mediated macrophage rebalance

Affiliations

Sodium nitrate protects against metabolic syndrome by sialin-mediated macrophage rebalance

Shaorong Li et al. Signal Transduct Target Ther. .

Abstract

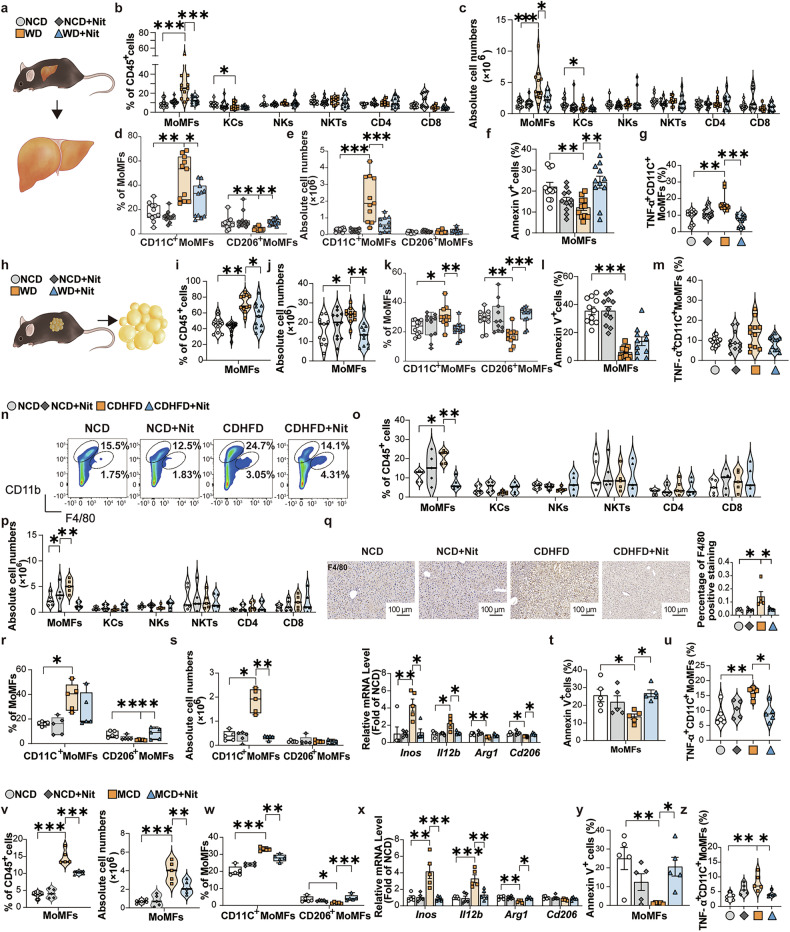
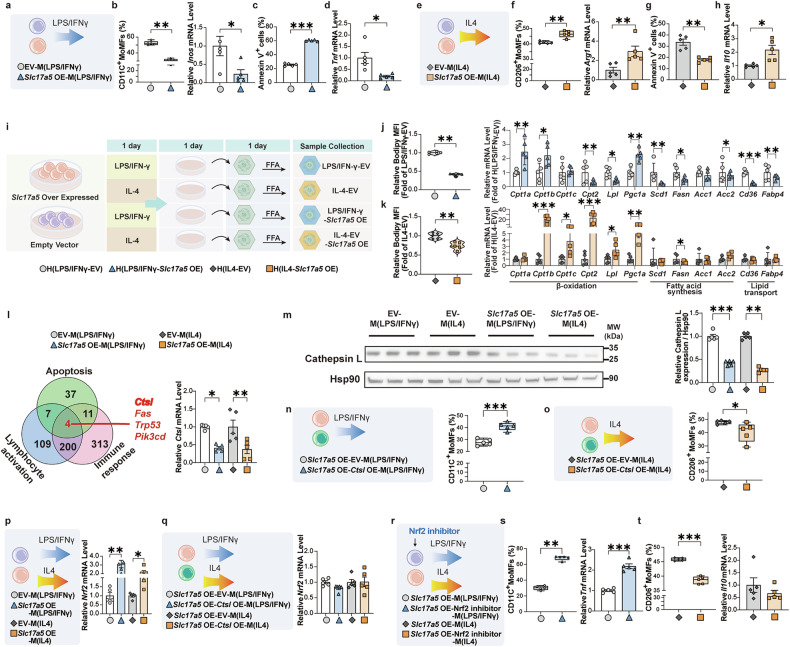
Metabolic syndrome, characterized by metabolic dysfunction-associated steatotic liver disease (MASLD) and type 2 diabetes mellitus (T2DM), poses a significant threat to patients' health worldwide; however, efficient treatment is currently unavailable. Here, we show that oral administration of sodium nitrate (NaNO3) greatly attenuates the development and advancement of MASLD-like and T2DM-like phenotypes in mice induced by choline-deficient high-fat, western, or methionine/choline-deficient diet. NaNO3 attenuates metabolic turbulence by rebalancing CD206+/CD11C+ polarization (anti-inflammatory/pro-inflammatory) and the function of bone marrow-derived macrophages (MoMFs). Using metabolic disorder animal models and bone marrow-reconstituted mice with mutated gene function in Slc17a5, which encodes sialin, we demonstrate that NaNO3 protects against metabolic disorders through the actions of sialin in MoMFs. NaNO3 can directly regulate MoMFs polarization and function in vitro and in mice, in which nitric oxide production from oral and enteral symbiotic bacteria is essentially abolished. At the molecular level, sialin, via the inhibition of the key transcription factor Rel, inhibits cathepsin L (CtsL) expression and thereby activates the Nrf2 pathway to modulate macrophage homeostasis and ameliorate metabolic abnormalities. Interestingly, the sialin-CtsL-Nrf2 pathway is downregulated in human macrophages from metabolic dysfunction-associated steatohepatitis (MASH) patients. Overall, we demonstrate the prophylactic and therapeutic effects of NaNO3 on metabolic syndrome and reveal a new macrophage rebalancing strategy involving NaNO3 through a novel sialin pathway. Our research indicates that NaNO3 may be a pharmaceutical agent for managing and alleviating metabolic turbulence in humans.


Conflict of interest statement

Competing interests: The authors declare no competing interests.

Figures

Fig. 1
Fig. 1
Dietary NaNO3 ameliorates lipid metabolic disorders. ak C57BL/6 mice received drinking water supplemented with 4 mM NaNO3 (Nit) or normal drinking water. After 1 week, half of each group was fed with a choline-deficient high-fat diet (CDHFD), and the others were given a normal control diet (NCD). After 16 weeks, all the mice were sacrificed. a Schematic overview of the experiment. b Nitrate concentrations in the plasma of the NCD and CDHFD groups (one-way ANOVA with a post hoc test, *P < 0.05, **P < 0.01, n = 5, biological replicates). c Hepatic nitrate concentrations of the NCD and CDHFD groups (one-way ANOVA with a post hoc test, *P < 0.05, ***P < 0.001, n = 5, biological replicates). d Body weight changes after the experiment in the NCD and CDHFD groups (one-way ANOVA with a post hoc test, *P < 0.05, ***P < 0.001, n = 5, biological replicates). e Plasma alanine aminotransferase (ALT) levels in the NCD and CDHFD groups (one-way ANOVA with a post hoc test, *P < 0.05, **P < 0.01, n = 5, biological replicates). f Plasma aspartate aminotransferase (AST) levels in the NCD and CDHFD groups (one-way ANOVA with a post hoc test, *P < 0.05, **P < 0.01, n = 5, biological replicates). g Representative H&E-stained mouse liver sections plus a graph showing the MASLD activity score (NAS), representative Oil Red O-stained mouse liver sections plus a graph showing the semiquantitative score. Scale bars: 100 μm (one-way ANOVA with a post hoc test, ***P < 0.001, n = 5, biological replicates). h Western blot images of α-SMA in the NCD and CDHFD groups (n = 5, biological replicates). i Hepatic hydroxyproline content of the NCD and CDHFD groups (one-way ANOVA with a post hoc test, **P < 0.01, ***P < 0.001, n = 5, biological replicates). j Relative mRNA expression of hepatic Col1a1 and Col1a3 of the NCD and CDHFD groups (Kruskal‒Wallis test for Col1a1, one-way ANOVA with a post hoc test for Col1a3, *P < 0.05, **P < 0.01, ***P < 0.001, n = 5, biological replicates). k Relative mRNA expression of hepatic inflammatory cytokine factors of the NCD and CDHFD groups (Kruskal‒Wallis test for Tnf and Il10, one-way ANOVA with a post hoc test for others, *P < 0.05, **P < 0.01, ***P < 0.001, n = 5, biological replicates). lp Two groups of C57BL/6 mice were fed with CDHFD, and the other group was given NCD for 8 weeks. The mice subsequently received drinking water supplemented with 4 mM NaNO3 (Nit) or normal drinking water for another 8 weeks while the diet remained. Then the plasma and livers were collected. l Schematic overview of the experiment in NCD- and CDHFD-fed nitrate-treated mice. m Changes in body weight after the experiment in NCD- and CDHFD-fed nitrate-treated mice (one-way ANOVA with a post hoc test, *P < 0.05, **P < 0.01, n = 5, biological replicates). n Plasma ALT levels in NCD- and CDHFD-fed nitrate-treated mice (one-way ANOVA with a post hoc test, ***P < 0.001, n = 5, biological replicates). op Representative H&E-stained mouse liver sections plus a graph showing the NAS and representative Oil Red O-stained mouse liver sections plus a graph showing the semiquantitative score. Scale bars: 200 μm (Kruskal‒Wallis test for NAS, one-way ANOVA with a post hoc test for Oil Red O-stained, *P < 0.05, ***P < 0.001, n = 5, biological replicates)
Fig. 2
Fig. 2
Dietary NaNO3 mitigates glucose and other systemic metabolic disorders in mice. a Fasting blood glucose levels in the normal control diet (NCD), NCD+Nit, choline-deficient high-fat diet (CDHFD), and CDHFD+Nit prevention groups (one-way ANOVA with a post hoc test, ***P < 0.001, n = 5, biological replicates). b Fasting blood glucose levels in the NCD-, CDHFD-, and CDHFD+Nit-treated groups (one-way ANOVA with a post hoc test, ***P < 0.001, n = 5, biological replicates). cu Two groups of mice were fed with western diet (WD), and the others were fed with NCD for 12 weeks. The mice subsequently received drinking water supplemented with 4 mM NaNO3 (Nit) or normal drinking water for another 12 weeks while the diet remained. Then the plasma and livers were collected. c Schematic overview of the experiment. d Nitrate concentrations in plasma of NCD- and WD-fed mice (Kruskal–Wallis test, ***P < 0.001, n = 11, biological replicates). e Nitrate concentrations in the livers of NCD- and WD-fed mice (Kruskal–Wallis test, **P < 0.01, ***P < 0.001, n = 11, biological replicates). f The body weight after the experiment in NCD- and WD-fed mice (Kruskal–Wallis test, *P < 0.05, ***P < 0.001, n = 11, biological replicates). g The weight of livers in NCD- and WD-fed mice (One-way ANOVA with a post hoc test, ***P < 0.001, n = 11, biological replicates). h The weight of gonadal adipose tissue (GAT) in NCD- and WD-fed mice (Kruskal–Wallis test, *P < 0.05, ***P < 0.001, n = 11, biological replicates). i The weight of perirenal adipose tissue (PrAT) in NCD- and WD-fed mice (Kruskal–Wallis test, *P < 0.05, ***P < 0.001, n = 11, biological replicates). j Fasting blood glucose levels in NCD- and WD-fed mice (one-way ANOVA with a post hoc test, ***P < 0.001, n = 11, biological replicates). k Glucose tolerance test (GTT) results and relative area under the curve values for the NCD- and WD-fed mice (one-way ANOVA with a post hoc test, *P < 0.05, ***P < 0.001, n = 11, biological replicates). l Insulin tolerance test (ITT) results and relative area under the curve values for the NCD- and WD-fed mice (Kruskal‒Wallis test, **P < 0.01, ***P < 0.001, n = 11, biological replicates). m The levels of insulin in the NCD- and WD-fed mice (Kruskal‒Wallis test, ***P < 0.001, n = 11, biological replicates). n Food intake per mouse every day in the NCD and WD groups (Kruskal‒Wallis test, n = 11, biological replicates). o Plasma alanine aminotransferase (ALT) levels in the NCD and WD groups (one-way ANOVA with a post hoc test, ***P < 0.001, n = 11, biological replicates). p Plasma aspartate aminotransferase (AST) levels in the NCD and WD groups (one-way ANOVA with a post hoc test, ***P < 0.001, n = 11, biological replicates). q The levels of plasma total cholesterol (TC) in NCD- and WD-fed mice (one-way ANOVA with a post hoc test, ***P < 0.001, n = 11, biological replicates). r The levels of plasma triglyceride (TG) in the NCD and WD groups (Kruskal‒Wallis test, **P < 0.01, ***P < 0.001, n = 11, biological replicates). su Representative H&E-stained mouse liver sections plus a graph showing the MASLD activity score (NAS) and representative Oil Red O-stained mouse liver sections plus a graph showing the semiquantitative score. Scale bars: 100 μm. Representative H&E-stained mouse GAT plus a graph showing the mean diameter of adipocytes. Scale bars: 200 μm (Kruskal‒Wallis test for NAS and the mean diameter of adipocytes, one-way ANOVA with a post hoc test for Oil Red O staining, *P < 0.05, ***P < 0.001, n= 11, biological replicates)
Fig. 3
Fig. 3
NaNO3 modulates MoMFs inflammatory responses and survival in vivo. am In the first 12 weeks, two groups of C57BL/6 mice were fed with a western diet (WD), and the others were fed with a normal control diet (NCD). The mice subsequently received drinking water supplemented with 4 mM NaNO3 (Nit) or normal drinking water for another 12 weeks while the diet remained. Then the plasma and livers were collected (see Fig. 2c). a Schematic overview of the experiments for the analysis of liver cells in the NCD and WD groups. b Proportions of hepatic bone marrow monocyte-derived macrophages (MoMFs), Kupffer cells (KCs), natural killer cells (NKs), NK T cells (NKTs), and CD4+ and CD8+ T cells of NCD and WD groups were assessed via flow cytometry plus a graph (one-way ANOVA with a post hoc test for MoMFs, and NKTs, the Kruskal‒Wallis test for KCs, NKs, and CD4+ and CD8+ T cells, *P < 0.05, ***P < 0.001, n = 11, biological replicates). c Absolute cell numbers of hepatic MoMFs, KCs, NKs, NKTs, and CD4+ and CD8+ T cells of NCD and WD groups were determined via flow cytometry (one-way ANOVA with a post hoc test for NKTs, the Kruskal‒Wallis test for MoMFs, KCs, NKs, and CD4+ and CD8+ T cells, *P < 0.05, ***P < 0.001, n = 11, biological replicates). d Proportions of hepatic CD11C+ MoMFs and CD206+ MoMFs of NCD and WD groups (Kruskal‒Wallis test, *P < 0.05, **P < 0.01, n = 11, biological replicates). e Absolute cell numbers of hepatic CD11C+ MoMFs and CD206+ MoMFs (Kruskal‒Wallis test for CD206+ MoMFs, one-way ANOVA with a post hoc test for CD11C+ MoMFs, ***P < 0.001, n = 11, biological replicates). f Apoptosis (annexin V+ cells) of hepatic MoMFs of NCD and WD groups (one-way ANOVA with a post hoc test, **P < 0.01, n = 11, biological replicates). g Proportion of hepatic TNF-α+ CD11C+ MoMFs of NCD and WD groups (Kruskal‒Wallis test, **P < 0.01, ***P < 0.001, n = 11, biological replicates). h Schematic overview of the experiment for the analysis of gonadal adipose cells in the NCD- and WD-fed mice. i Proportions of MoMFs in gonadal adipose tissue (GAT) of the NCD and WD groups (Kruskal‒Wallis test, *P < 0.05, **P < 0.01, n = 11, biological replicates). j Absolute cell numbers of MoMFs in the GAT of the NCD and WD groups (one-way ANOVA with a post hoc test, *P < 0.05, **P < 0.01, n = 11, biological replicates). k Proportions of CD11C+ MoMFs and CD206+ MoMFs in the GAT of the NCD and WD groups (Kruskal‒Wallis test, *P < 0.05, **P < 0.01, ***P < 0.001, n = 11, biological replicates). l Apoptosis (annexin V+ cells) of MoMFs in GAT of the NCD and WD groups (one-way ANOVA with a post hoc test, ***P < 0.001, n = 11, biological replicates). m Proportion of TNF-α+ CD11C+ MoMFs in the GAT of the NCD and WD groups (one-way ANOVA with a post hoc test, n = 11, biological replicates). nu C57BL/6 mice received 4 mM NaNO3 (Nit) or normal drinking water. After 1 week, half of each group was fed with a choline-deficient high-fat diet (CDHFD), and the others were fed with a NCD for 16 weeks (see Fig. 1a). n, o Proportions of hepatic MoMFs (shown as CD11bhighF4/80int cell circles in n), KCs (shown as CD11bintF4/80high cell circles in n), NKs, NKTs, CD4+ and CD8+ T cells of NCD and CDHFD groups were assessed via flow cytometry plus graphs (Kruskal‒Wallis test for MoMFs and NKs, one-way ANOVA with a post hoc test for KCs, NKTs, and CD4+ and CD8+ T cells, *P < 0.05, **P < 0.01, n = 5, biological replicates). p Absolute cell numbers of hepatic MoMFs, KCs, NKs, NKTs, CD4+ and CD8+ T cells of NCD and CDHFD groups were assessed via flow cytometry plus a graph (Kruskal‒Wallis test for KCs, NKs, CD4+ T cells, One-way ANOVA with a post hoc test for MoMFs, NKTs, and CD8+ T cells, *P < 0.05, **P < 0.01, n = 5, biological replicates). q Representative F4/80-stained mouse liver sections plus a graph showing F4/80-positive staining in NCD and CDHFD groups. Scale bars: 100 μm (one-way ANOVA with a post hoc test, *P < 0.05, n = 5, biological replicates). r Proportions of CD11C+ MoMFs and CD206+ MoMFs in the livers of the NCD and CDHFD groups (Kruskal‒Wallis test for CD206+ MoMFs, one-way ANOVA with a post hoc test for CD11C+ MoMFs, *P < 0.05, **P < 0.01, n = 5, biological replicates). s Absolute cell numbers of hepatic CD11C+ MoMFs and CD206+ MoMFs of the NCD and CDHFD groups (Kruskal‒Wallis test, *P < 0.05, **P < 0.01, n = 5, biological replicates). Relative hepatic Inos, Il12b, Arg1, and Cd206 mRNA expression of the NCD and CDHFD groups (Kruskal‒Wallis test for Inos, Il12b, and Arg1, one-way ANOVA with a post hoc test for Cd206, *P < 0.05, **P < 0.01, n = 5, biological replicates). t Apoptosis (annexin V+ cells) of hepatic MoMFs of NCD and CDHFD groups (one-way ANOVA with a post hoc test, *P < 0.05, n = 5, biological replicates). u Proportion of hepatic TNF-α+ CD11C+ MoMFs of NCD and CDHFD groups (one-way ANOVA with a post hoc test, *P < 0.05, **P < 0.01, n = 5, biological replicates). vz Another group of C57BL/6 mice received drinking water supplemented with 4 mM NaNO3 (Nit) or normal drinking water. After 1 week, half of each group was fed with a methionine/choline-deficient diet (MCD), and the other half was fed with a NCD for 4 weeks (see Supplementary Fig. 2c). v Proportions of hepatic MoMFs of the NCD and MCD groups (one-way ANOVA with a post hoc test, ***P < 0.001, n = 5, biological replicates). Absolute cell numbers of hepatic MoMFs of the NCD and MCD groups (one-way ANOVA with a post hoc test, **P < 0.01, ***P < 0.001, n = 5, biological replicates). w Proportions of hepatic CD11C+ MoMFs and CD206+ MoMFs of NCD and MCD groups (Kruskal‒Wallis test for CD206+ MoMFs, one-way ANOVA with a post hoc test for CD11C+ MoMFs, *P < 0.05, **P < 0.01, ***P < 0.001, n = 5, biological replicates). x Relative hepatic Inos, Il12b, Arg1, and Cd206 mRNA expression of the NCD and MCD groups (Kruskal‒Wallis test for Cd206, one-way ANOVA with a post hoc test for Inos, Il12b, and Arg1, *P < 0.05, **P < 0.01, ***P < 0.001, n = 5, biological replicates). y Apoptosis (annexin V+ cells) of hepatic MoMFs of NCD and MCD groups (one-way ANOVA with a post hoc test, *P < 0.05, **P < 0.01, n = 5, biological replicates). z Proportion of hepatic TNF-α+ CD11C+ MoMFs of NCD and MCD groups (Kruskal‒Wallis test, *P < 0.05, **P < 0.01, n = 5, biological replicates)
Fig. 4
Fig. 4
NaNO3 modulates MoMFs inflammatory responses and survival in vitro, and dietary NaNO3 inhibits metabolic disorders and liver inflammation in ABX mice. ah Bone marrow-derived monocytes were harvested and treated with or without 2 mM NaNO3 for 48 h, induced in vitro to differentiate into MoMFs, and polarized into LPS/IFN-γ-stimulated MoMFs (M(LPS/IFNγ)) or IL-4-stimulated MoMFs (M(IL4)). a Schematic overview of the experiment with M(LPS/IFNγ). b Proportion of CD11C+ cells and relative Inos mRNA expression in M(LPS/IFNγ) (Kruskal‒Wallis test for CD11C+ cells, Student’s t-test for Inos, **P < 0.01, ***P < 0.001, n = 5, biological replicates). c Apoptosis (annexin V+ cells) in M(LPS/IFNγ) (Student’s t-test, ***P < 0.001, n = 5, biological replicates). d Proportion of TNF-α positive CD11C+ MoMFs plus graph and relative Tnf mRNA expression in M(LPS/IFNγ) (Student’s t-test, ***P < 0.001, n = 5, biological replicates). e Schematic overview of the experiment in M(IL4). f Proportion of CD206+ cells and relative Arg1 mRNA expression in M(IL4) (Kruskal‒Wallis test for CD206+ cells, Student’s t-test for Arg1, **P < 0.01, n = 5, biological replicates). g Representative flow cytometric plots of apoptosis (annexin V+ cells) plus graph in M(IL4) (Student’s t-test, ***P < 0.001, n = 5, biological replicates). h Relative Il10 mRNA expression in M(IL4) (Student’s t-test, *P < 0.05, n = 5, biological replicates). iu C57BL/6 mice with broad-spectrum antibiotics (ABX) were generated. After 2 weeks, the mice received drinking water supplemented with 4 mM NaNO3 (Nit) or normal water for 1 week, after which all the mice were fed with a methionine/choline-deficient diet (MCD). A single oral ABX gavage was given to all the mice 2 weeks later. After another 2 weeks, the plasma and livers were collected. i Nitrite concentrations in the plasma and livers of MCD and MCD-ABX groups (Kruskal‒Wallis test, *P < 0.05, **P < 0.01, n = 5, biological replicates). j Schematic overview of the experiment in MCD-fed ABX mice treated with or without NaNO3. k Plasma alanine aminotransferase (ALT) levels in MCD-ABX groups treated with or without NaNO3 (Student’s t-test, **P < 0.01, n = 5, biological replicates). l Plasma aspartate aminotransferase (AST) levels in MCD-ABX groups treated with or without NaNO3 (Student’s t-test, **P < 0.01, n = 5, biological replicates). m Nitrate concentrations in the plasma and livers of MCD-ABX groups treated with or without NaNO3 (Kruskal‒Wallis test for liver, Student’s t-test for plasma, **P < 0.01, n = 5, biological replicates). n, o Representative H&E- and Oil Red O-stained liver sections plus a graph showing the NAS and semiquantitative score. Scale bars: 100 μm (Kruskal‒Wallis test, *P < 0.05, n = 5, biological replicates). p Proportions of MoMFs in the livers of MCD-ABX groups treated with or without NaNO3 (Kruskal‒Wallis test, **P < 0.01, n = 5, biological replicates). q Absolute cell numbers of hepatic MoMFs of MCD-ABX groups treated with or without NaNO3 (Student’s t-test, **P < 0.01, n = 5, biological replicates). r Proportions of hepatic CD11C+ MoMFs and CD206+ MoMFs and relative Inos, Il12b, and Arg1 mRNA expression of MCD-ABX groups treated with or without NaNO3 (Student’s t-test for CD11C+ MoMFs, CD206+ MoMFs, Il12b, and Arg1, Kruskal–Wallis test for Inos, *P < 0.05, **P < 0.01, ***P < 0.001, n = 5, biological replicates). s Apoptosis (annexin V+ cells) of hepatic MoMFs of MCD-ABX groups treated with or without NaNO3 (Kruskal‒Wallis test, *P < 0.05, n = 5, biological replicates). t Proportion of hepatic TNF-α positive CD11C+ MoMFs of the MCD-ABX groups treated with or without NaNO3 (Student’s t-test, *P < 0.05, n = 5, biological replicates). u Relative mRNA expression of hepatic pro-inflammatory and anti-inflammatory cytokine factors of MCD-ABX groups treated with or without NaNO3 (Kruskal‒Wallis test for Il13, Student’s t-test for others, *P < 0.05, **P < 0.01, n = 5, biological replicates)
Fig. 5
Fig. 5
Sialin plays a key role in the modulation of MoMFs by NaNO3 in vitro and in vivo. a Analysis of single-cell sequencing data reveals sialin expression levels in human hepatic macrophages and correlation analysis with NAS score (Student’s t-test for sialin expression, nonparametric Spearman’s test for correlation analysis, *P < 0.05, CTRL n = 2, MASH n = 6, biological replicates). b Proportions of sialin-positive bone marrow monocyte-derived macrophages (MoMFs) plus graphs of normal diet (NCD)- and western diet (WD)-fed mice (one-way ANOVA with a post hoc test, *P < 0.05, **P < 0.01, n = 5, biological replicates). ce Bone marrow-derived monocytes were harvested and treated with or without 2 mM NaNO3 for 48 h, induced in vitro to differentiate into MoMFs, and polarized into LPS/IFN-γ-stimulated MoMFs (M(LPS/IFNγ)) or IL-4-stimulated MoMFs (M(IL4)). c Schematic overview of the experiments with M(LPS/IFNγ) and M(IL4). d Relative expression of sialin (normalized to Hsp90) in M(LPS/IFNγ) and M(IL4) (one-way ANOVA with a post hoc test, *P < 0.05, **P < 0.01, n = 5, biological replicates). e Relative Slc17a5 mRNA level in M(LPS/IFNγ) and M(IL4) (Kruskal‒Wallis test, *P < 0.05, **P < 0.01, n = 5, biological replicates). fm Bone marrow-derived monocytes were harvested and treated with or without 2 mM NaNO3 for 48 h, transfected with Slc17a5 or scrambled siRNA (control) in vitro, induced to differentiate into MoMFs, and polarized into M(LPS/IFNγ) or M(IL4). f Schematic overview of the experiments involving M(LPS/IFNγ) with Slc17a5 or scrambled siRNA. g Proportion of CD11C+ cells and relative Inos mRNA level in M(LPS/IFNγ) treated with Slc17a5 or scrambled siRNA (Kruskal‒Wallis test, *P < 0.05, **P < 0.01, n = 5, biological replicates). h Apoptosis (annexin V+ cells) in M(LPS/IFNγ) with Slc17a5 or scrambled siRNA (Student’s t-test, ***P < 0.001, n = 5, biological replicates). i Relative Tnf mRNA expression in M(LPS/IFNγ) treated with Slc17a5 or scrambled siRNA (Kruskal‒Wallis test, **P < 0.01, n = 5, biological replicates). j Schematic overview of the experiment involving M(IL4) with Slc17a5 or scrambled siRNA. k Proportion of CD206+ cells and relative Arg1 mRNA expression in M(IL4) treated with Slc17a5 or scrambled siRNA (Kruskal‒Wallis test for CD206+ cells, Student’s t-test for Arg1, **P < 0.01,***P < 0.001, n = 5, biological replicates). l Apoptosis (annexin V+ cells) in M(IL4) treated with Slc17a5 or scrambled siRNA (Student’s t-test, **P < 0.01, n = 5, biological replicates). m Relative Il10 mRNA expression in M(IL4) treated with Slc17a5 or scrambled siRNA (Student’s t-test, ***P < 0.001, n = 5, biological replicates). nx Irradiated CD45.1 congenic mice were transplanted with donor bone marrow, wild-type (WT) C57BL/6 mice, or Slc17a5 sgRNA two-cell embryo mice. After 4 weeks, half of each group received drinking water with 4 mM NaNO3 (Nit), while the other half had access to normal drinking water. After 1 week, all the mice were fed with a daily methionine/choline-deficient diet (MCD). After another 4 weeks, all the mice were sacrificed, and the plasma and liver were collected. n Relative Slc17a5 mRNA expression in bone marrow from WT C57BL/6 mice and Slc17a5 sgRNA two-cell embryo mice prior to bone marrow transplantation into irradiated CD45.1 congenic mice (Student’s t-test, ***P < 0.001, n = 5, biological replicates). o Schematic overview of the transplantation experiment. p Plasma alanine transaminase (ALT) levels in transplanted mice (one-way ANOVA with a post hoc test, *P < 0.05, NS no significance, n = 5, biological replicates). q, r Representative H&E-stained liver sections plus a graph showing the MASLD activity score (NAS) and representative Oil Red O-stained liver sections plus a graph showing the semiquantitative score. Scale bars: 200 μm (Kruskal‒Wallis test for NAS, one-way ANOVA with a post hoc test for Oil Red O staining, **P < 0.01, ***P < 0.001, NS no significance, n = 5, biological replicates). s Relative mRNA level of hepatic pro-inflammatory and anti-inflammatory cytokine factors of transplanted mice (one-way ANOVA with a post hoc test, *P < 0.05, **P < 0.01, NS no significance, n = 5, biological replicates). t Proportion of MoMFs in the livers of transplanted mice (Kruskal‒Wallis test, **P < 0.01, NS no significance, n = 5, biological replicates). u Absolute cell numbers of MoMFs in the livers of transplanted mice (one-way ANOVA with a post hoc test, **P < 0.01, NS no significance, n = 5, biological replicates). v Proportions of CD11C+ MoMFs, and CD206+ MoMFs in the livers of transplanted mice (Kruskal‒Wallis test for CD206+ MoMFs, one-way ANOVA with a post hoc test for CD11C+ MoMFs, *P < 0.05, NS no significance, n = 5, biological replicates). w Apoptosis (annexin V+ cells) of MoMFs, CD11C+ MoMFs, and CD206+ MoMFs in the livers of transplanted mice (one-way ANOVA with a post hoc test, **P < 0.01, NS no significance, n = 5, biological replicates). x Proportion of TNF-α positive CD11C+ MoMFs in the livers of transplanted mice (Kruskal‒Wallis test, *P < 0.05, NS no significance, n = 5, biological replicates)
Fig. 6
Fig. 6
Sialin directly regulates macrophage polarization and function by downregulating CtsL expression and activating Nrf2. ah Overexpression of sialin (Slc17a5 OE) or empty vector (EV)-macrophages were cultured in vitro and polarized into LPS/IFN-γ-stimulated MoMFs (M(LPS/IFNγ)) or IL-4-stimulated MoMFs (M(IL4)). a Schematic overview of the experiments involving EV- and Slc17a5 OE-M(LPS/IFNγ). b Proportion of CD11C+ cells and relative Inos mRNA expression in EV- and Slc17a5 OE-M(LPS/IFNγ) (Kruskal‒Wallis test, *P < 0.05, **P < 0.01, n = 5, biological replicates). c Apoptosis (annexin V+ cells) in EV- and Slc17a5 OE-M(LPS/IFNγ) (Student’s t-test, ***P < 0.001, n = 5, biological replicates). d Relative Tnf mRNA expression in EV- and Slc17a5 OE-M(LPS/IFNγ) (Student’s t-test, *P < 0.05, n = 5, biological replicates). e Schematic overview of the experiments involving EV- and Slc17a5 OE-M(IL4). f Proportion of CD206+ cells and relative Arg1 mRNA expression in EV- and Slc17a5 OE-M(IL4) (Kruskal‒Wallis test for Arg1, one-way ANOVA with a post hoc test for CD206+ cells, **P < 0.01, n = 5, biological replicates). g Apoptosis (annexin V+ cells) in EV- and Slc17a5 OE-M(IL4) (one-way ANOVA with a post hoc test, **P < 0.01, n = 5, biological replicates). h Relative Il10 mRNA expression in EV- and Slc17a5 OE-M(IL4) (Student’s t-test, *P < 0.05, n = 5, biological replicates). ik EV- or Slc17a5 OE-macrophages were cultured in vitro and polarized into M(LPS/IFNγ) or M(IL4) for one day. Then, the culture medium was transferred to hepatocytes (H(LPS/IFNγ), H(IL4)), and free fatty acid (FFA) was added for one day. i Schematic overview of the experiments involving FFA-stimulated H(LPS/IFNγ) and H(IL4). j Relative MFI of Bodipy and mRNA expression in H(LPS/IFNγ) (Kruskal‒Wallis test for Bodipy, Student’s t-test for mRNA, *P < 0.05, **P < 0.01, ***P < 0.001, n = 5, biological replicates). k Relative MFI of Bodipy and mRNA expression in H(IL4) (Kruskal‒Wallis test for Cpt1a, Pgc1a, Scd1, Acc1, and Cd36, Student’s t-test for Bodipy and others, *P < 0.05, **P < 0.01, ***P < 0.001, n = 5, biological replicates). l mRNA alterations associated with the EV- or Slc17a5 OE-macrophages were identified by RNA sequencing. Relative Ctsl mRNA expression (one-way ANOVA with a post hoc test, *P < 0.05, **P < 0.01, n = 5, biological replicates). m Relative protein expression of cathepsin L (normalized to Hsp90 expression) (Kruskal‒Wallis test for M(LPS/IFNγ), one-way ANOVA with a post hoc test for M(IL4), **P < 0.01, ***P < 0.001, n = 5, biological replicates). n, o Slc17a5 OE-macrophages transfected with the Ctsl OE plasmid or EV in vitro were induced to differentiate into MoMFs and polarized into M(LPS/IFNγ) or M(IL4). n Proportion of CD11C+ cells in Slc17a5 OE- and Ctsl- Slc17a5 OE-M (LPS/IFNγ) (Student’s t-test, ***P < 0.001, n = 5, biological replicates). o Proportion of CD206+ cells in Slc17a5 OE- and Ctsl- Slc17a5 OE-M(IL4) populations (Student’s t-test, *P < 0.05, n = 5, biological replicates). p EV- or Slc17a5 OE-macrophages were cultured in vitro and polarized into M(LPS/IFNγ) or M(IL4). Relative Nrf2 mRNA expression in CD11C+ and CD206+ MoMFs (Kruskal‒Wallis test, *P < 0.05, **P < 0.01, n = 5, biological replicates). q EV- or Slc17a5 OE-macrophages transfected with EV- or Ctsl OE plasmid in vitro were induced to differentiate into MoMFs and polarized into M(LPS/IFNγ) or M(IL4). Relative Nrf2 mRNA expression in CD11C+ and CD206+ MoMFs (Kruskal‒Wallis test, n = 5, biological replicates). rt EV- or Slc17a5 OE-macrophages, treated with or without a Nrf2 inhibitor (ML385) in vitro, induced to differentiate into MoMFs, polarized into M(LPS/IFNγ) or M(IL4). r Schematic overview of the experiments involving ML385-induced M(LPS/IFNγ) and M(IL4). s Proportion of CD11C+ cells and relative Tnf mRNA expression in ML385-induced M(LPS/IFNγ) (Kruskal‒Wallis test for CD11C+ cells, Student’s t-test for Tnf, **P < 0.01, ***P < 0.001, n = 5, biological replicates). t Proportion of CD206+ cells and relative Il10 mRNA expression in ML385-induced M(IL4) (Kruskal‒Wallis test for Il10, Student’s t-test for CD206+ cells, ***P < 0.001, n = 5, biological replicates)
Fig. 7
Fig. 7
Sialin activates the Nrf2 pathway by inhibiting the nuclear translocation of Rel and downregulating CtsL expression. a Overexpression of sialin (Slc17a5 OE)- or empty vector (EV) -macrophages were cultured in vitro, and polarized into LPS/IFN-γ-stimulated MoMFs (M(LPS/IFNγ)) or IL-4-stimulated MoMFs (M(IL4)). Rel in both the IP-MS and Ctsl promoter. b IP‒MS and analysis of the IgG-EV, EV, IgG-Slc17a5 OE, and Slc17a5 OE groups. Rel was screened. c CoIP of Rel binding to sialin. d Endogenous interaction between Rel and sialin in macrophages via proximity ligation assay (PLA). e Rel in the nucleus and cytoplasm of EV- or Slc17a5 OE-macrophages. f Relative protein cathepsin L level within the nucleus and cytoplasm of EV- and Slc17a5 OE- macrophages (Kruskal‒Wallis test for M(IL4), one-way ANOVA with a post hoc test for M(LPS/IFNγ), **P < 0.01, ***P < 0.001, n = 5, biological replicates). g Overall view of the docking model generated via the Z-DOCK server. Sialin is shown in blue, Rel in orange, and the complex surface in red. The dashed box indicates the predicted interaction interface, which is located within the flexible, hydrophilic N-terminal cytoplasmic region of sialin. h Predicted binding sites between the sialin–Rel complex via PDBePISA tools. i Close-up view of representative hydrogen bond interactions: SER17–LYS210 (2.574 Å), GLU14–LYS213 (3.337 Å), and a third pair at 3.372 Å. j Molecular docking of wild-type (WT) sialin and the alanine-substituted mutant (sialin-AA, SER17/GLU14→Ala). The mutant shows a higher binding free energy (WT: ΔG = −19.1 kcal/mol, AA: ΔG = −7.12 kcal/mol). k The TFBSs of Rel binding sites from the transcription start site of Ctsl were predicted. l Relative luciferase activity of Rel-Ctsl binding (Student’s t-test, ***P < 0.001, n = 9, biological replicates). m Relative Rel expression of EV- or Slc17a5 OE-macrophages polarized into M(LPS/IFNγ) (Student’s t-test, NS no significance, n = 5, biological replicates). n Fold change in Rel binding to the Ctsl promoter (Kruskal‒Wallis test, ***P < 0.001, n = 6, biological replicates). o Relative Rel expression of EV- or Slc17a5 OE-macrophages polarized into M(IL4) (Student’s t-test, NS no significance, n = 5, biological replicates). p Fold change in Rel binding to the Ctsl promoter (one-way ANOVA with a post hoc test, ***P < 0.001, n = 6, biological replicates)
Fig. 8
Fig. 8
NaNO3 regulates the inflammatory response and survival of human macrophages in vitro. a Analysis of single-cell sequencing data from the GSE212837 dataset revealed NRF2 expression in macrophages and NRF2, ARG1, and CD206 expression in SLC17A5-positive and SLC17A5-negative macrophages (Student’s t-test, ***P < 0.001, CTRL n = 2, MASH n = 6, biological replicates). b Evaluation of single-cell sequencing data from the GSE189600 dataset revealed NRF2, ARG1, and CD206 expression in SLC17A5-positive and SLC17A5-negative macrophages. c-i Human blood monocytes were cultured in vitro, treated with or without 2 mM NaNO3, induced to differentiate into macrophages, and polarized into LPS/IFN-γ-stimulated MoMFs (M(LPS/IFNγ)) or IL-4-stimulated MoMFs (M(IL4)). c Schematic overview of experiment in M(LPS/IFNγ). Proportion of CD11C+ cells and relative INOS expression (Student’s t-test, **P < 0.01, ***P < 0.001, n = 5, biological replicates). d Apoptosis (annexin V+ cells) in M(LPS/IFNγ) (Student’s t-test, **P < 0.01, n = 5, biological replicates). e Relative TNF mRNA level in M(LPS/IFNγ) (Student’s t-test, **P < 0.01, n = 5, biological replicates). f Schematic overview of the experiment in M(IL4). Proportion of CD206+ cells and relative ARG1 mRNA expression (Kruskal–Wallis test for CD206+ cells, Student’s t-test for ARG1, *P < 0.05, **P < 0.01, n = 5, biological replicates). g Apoptosis (annexin V+ cells) in M(IL4) (Student’s t-test, **P < 0.01, n = 5, biological replicates). h Relative IL10 mRNA level in M(IL4) (Student’s t-test, *P < 0.05, n = 5, biological replicates). i Relative SLC17A5, CTSL and NRF2 mRNA level in M(LPS/IFNγ) and M(IL4) (One-way ANOVA with a post hoc test for SLC17A5 and CTSL, Kruskal–Wallis test for NRF2, *P < 0.05, **P < 0.01, ***P < 0.001, n = 5, biological replicates). jp Human blood monocytes were treated with or without 2 mM NaNO3 and then transfected with SLC17A5 siRNA or scrambled siRNA in vitro, and then polarized into M(LPS/IFNγ) or M(IL4). j Schematic overview of the experiments involving SLC17A5 or scrambled siRNA of M(LPS/IFNγ). Proportion of CD11C+ cells and relative INOS expression (Student’s t-test, **P < 0.01, ***P < 0.001, n = 5, biological replicates). k Apoptosis (annexin V+ cells) in SLC17A5 or scrambled siRNA-treated M(LPS/IFNγ) (Student’s t-test, **P < 0.01, n = 5, biological replicates). l Relative TNF mRNA expression in SLC17A5 or scrambled siRNA-treated M(LPS/IFNγ) (Kruskal‒Wallis test, **P < 0.01, n = 5, biological replicates). m Schematic overview of the experiments involving SLC17A5 or scrambled siRNA-treated M(IL4). Proportion of CD206+ cells and relative ARG1 mRNA expression (Student’s t-test, **P < 0.01, ***P < 0.001, n = 5, biological replicates). n Apoptosis (annexin V+ cells) in SLC17A5 or scrambled siRNA of M(IL4) (Student’s t-test, *P < 0.05, n = 5, biological replicates). o Relative IL10 mRNA expression in SLC17A5 or scrambled siRNA-transfected M(IL4) (Student’s t-test, **P < 0.01, n = 5, biological replicates). p Relative CTSL and NRF2 mRNA expression in SLC17A5 or scrambled siRNA of M(LPS/IFNγ) and M(IL4) (Kruskal‒Wallis test for M(LPS/IFNγ), Student’s t-test for M(IL4), *P < 0.05, **P < 0.01, n = 5, biological replicates). qw Human blood monocytes were treated with or without 2 mM NaNO3, transfected with a CTSL overexpression plasmid (OE) or an empty vector (EV) in vitro, and polarized into M(LPS/IFNγ) or M(IL4). q Schematic overview of the experiments involving EV- or CTSL OE-M(LPS/IFNγ). Proportion of CD11C+ cells and relative INOS expression (Student’s t-test, ***P < 0.001, n = 5, biological replicates). r Apoptosis (annexin V+ cells) in EV- or CTSL OE-M(LPS/IFNγ) (Kruskal‒Wallis test, **P < 0.01, n = 5, biological replicates). s Relative TNF mRNA expression in EV- or CTSL OE-M(LPS/IFNγ) (Student’s t-test, ***P < 0.001, n = 5, biological replicates). t Schematic overview of the experiments on the EV- or CTSL OE-M(IL4). Proportion of CD206+ cells and relative ARG1 mRNA expression (Kruskal‒Wallis test for CD206+ cells, Student’s t-test for ARG1, **P < 0.01, n = 5, biological replicates). u Apoptosis (annexin V+ cells) in EV- or CTSL OE-M(IL4) (Student’s t-test, ***P < 0.001, n = 5, biological replicates). v Relative IL10 mRNA expression in EV- or CTSL OE-M(IL4) (Kruskal‒Wallis test, **P < 0.01, n = 5, biological replicates). w Relative NRF2 mRNA expression in EV- or CTSL OE-M(LPS/IFNγ) and M(IL4) (Kruskal‒Wallis test for M(LPS/IFNγ), Student’s t-test for M(IL4), **P < 0.01, n = 5, biological replicates). x Schematic overview of the proposed mechanism of action for the immunomodulatory effects of NaNO3 via the sialin-cathepsin L axis in the liver

References

    1. Younossi, Z. et al. Global burden of NAFLD and NASH: trends, predictions, risk factors and prevention. Nat. Rev. Gastroenterol. Hepatol.15, 11–20 (2018). - PubMed
    1. Powell, E. E., Wong, V. W. & Rinella, M. Non-alcoholic fatty liver disease. Lancet397, 2212–2224 (2021). - PubMed
    1. Rinella, M. E. et al. A multisociety Delphi consensus statement on new fatty liver disease nomenclature. J. Hepatol.79, 1542–1556 (2023). - PubMed
    1. Huang, D. Q., El-Serag, H. B. & Loomba, R. Global epidemiology of NAFLD-related HCC: trends, predictions, risk factors and prevention. Nat. Rev. Gastroenterol. Hepatol.18, 223–238 (2021). - PMC - PubMed
    1. Krenkel, O. & Tacke, F. Liver macrophages in tissue homeostasis and disease. Nat. Rev. Immunol.17, 306–321 (2017). - PubMed