. 2025 Oct 1;16(1):8743.
doi: 10.1038/s41467-025-63711-9.

Long-persisting SARS-CoV-2 spike-specific CD4+ T cells associated with mild disease and increased cytotoxicity post COVID-19

Affiliations

Long-persisting SARS-CoV-2 spike-specific CD4+ T cells associated with mild disease and increased cytotoxicity post COVID-19

Guihai Liu et al. Nat Commun. .

Abstract

The recent COVID-19 pandemic left behind the lingering question as whether new variants of concern might cause further waves of infection. Thus, it is important to investigate the long-term protection gained via vaccination or exposure to the SARS-CoV-2 virus. Here we compare the evolution of memory T-cell responses following primary infection with subsequent antigen exposures. Single-cell TCR analysis of three dominant SARS-CoV-2 spike-specific CD4+ T-cell responses identifies the dominant public TCRα clonotypes pairing with diverse TCRβ clonotypes that associated with mild disease at primary infection. These clonotypes are found at higher frequencies in pre-pandemic repertoires compared to other epitope-specific clonotypes. Longitudinal transcriptomics and TCR analysis, combined with functional evaluation, reveals that the clonotypes persisting 3-4 years post initial infection exhibit distinct functionality compared to those that were lost. Furthermore, spike-specific CD4+ T cells at this time point show decreased Th1 signatures and enhanced GZMA-driven cytotoxic transcriptomic profiles that were independent of TCR clonotype and associated with viral suppression. In summary, we identify common public TCRs used by immunodominant spike-specific memory CD4+ T-cells, associated with mild disease outcome, which likely play important protective roles to subsequent viral infection events.


Conflict of interest statement

Competing interests: The authors declare no competing interests.

Figures
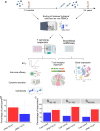
Fig. 1
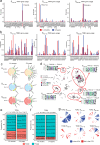
Fig. 1. Characterising three immunodominant spike-specific T cell responses targeting S166–180-DPB1*04:01, S751–765-DRB1*15:01 and S866–880-DRB1*15:01 epitopes in COVID-19 patients.
a Overview of sample collection and study design. Created in BioRender. Dong, T. (2025) https://BioRender.com/r48m616. b Proportion of patients with HLA-DPB1*04:01 (n = 30/45) and DRB1*15:01 (n = 17/47) in overall cohort. c Frequency of convalescent COVID-19 patients with T cells responding to S166–180 (n = 21/40), S751–765 (n = 12/37) or S866–880 (n = 10/36) peptide stimulation.
Fig. 2
Fig. 2. TCR repertoire analysis of spike-specific CD4+ T cells at 1–3 months and 3–4 years post infection.
a, b TRAV (a) and TRBV (b) gene usage of S166–180-, S751–765- and S866–880-specific T cells at 1–3 months (red bars) and 3–4 years (blue bars) post primary infection. c TRBV genes pairing with the dominant TRAV gene for S166–180- (TRAV35), S751–765- (TRAV12-1) and S866–880- (TRAV26-1) specific cells at 1–3 months (left) and 3–4 years (right). d TCRα clonotype similarity network. Each vertex corresponds to an individual TCR clonotype, with edges connecting vertices if the CDR3 amino acid sequences show a normalised edit distance >0.9 (scRepertoire). The size of the vertex corresponds to the TCR clonotype frequency, and colour represents the timepoint at which they are found. Cluster motifs were generated using ggseqlogo and amino acid colours based on their biochemical properties. e The proportion of TCRα clonotypes classified as public (coral) or private (cyan) in our dataset. Percentages denote the proportion of cells of a particular epitope specificity classed as public or private. χ2 test of independence was used to compare proportions between 1–3 month and 3–4 years, with two-sided p-values calculated. f Proportion of TCRβ clonotypes classified as public (coral) or private (cyan) in our dataset. Percentages denote the proportion of cells of a particular epitope specificity classed as public or private. χ2 test of independence was used to compare proportions between 1–3 months and 3–4 years, with two-sided p values calculated. g Pie charts denoting the proportion of TCRα (top) and TCRβ (bottom) clonotypes found in the Observed TCR space (OTS).
Fig. 3
Fig. 3. Association between dominant TCRα clonotypes and disease severity.
a, b Frequency of cells from the Meckiff et al. dataset (a) and the Bacher et al. dataset (b) with dominant and non-dominant TCRα clonotypes split by COVID-19 disease severity of the donor. χ2 test of independence was used to compare proportions between dominant and non-dominant TCRα clonotypes. χ2 test of independence was used to compare proportions between dominant and non-dominant and two-sided p values calculated. c Frequency of cells from the Meckiff et al. and Bacher et al. datasets combined with dominant and non-dominant TCRα clonotypes split by COVID-19 disease severity of the donor. χ2 test of independence was used to compare proportions between dominant and non-dominant TCRα clonotypes and two-sided p values calculated. Non-hospitalised COVID = Meckiff Mild + Bacher non-hospital; Mild hospitalised = Meckiff Ward + Bacher mild; Severe = Meckiff ICU + Bacher severe. d Percentage of the total TCR repertoire of dominant (blue bars) and non-dominant (red bars) TCRα clonotypes in pre-pandemic individuals (n = 6) from the Spindler et al. dataset. Plotted at median ± IQR. The Wilcoxon signed-rank test was used to compare between groups and two-tailed p values calculated.
Fig. 4
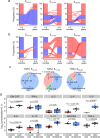
Fig. 4. Longitudinal TCRα and TCRβ analysis between 1–3 months and 3-4 years after infection.
a Alluvial plots highlighting the TCRα clonotypes at 1–3 months and 3–4 years, with links between columns denoting clonotypes found at both timepoints for S166–180- (left), S751–765- (middle) and S866–880-specific (right) T cells. Blue links are the previously identified dominant TCRα clonotypes. b Alluvial plots highlighting the TCRβ clonotypes that pair with the previously identified dominant TCRα clonotypes at 1–3 months and 3–4 years, with links between the columns denoting clonotypes found at both timepoints. Red clonotypes are clonotypes found at both timepoints, whereas blue blocks are clonotypes found only at one timepoint. c Pie charts of the available clonal functional data based on whether the clone TCRα clonotype is found at both timepoints (blue), 1–3 month only (pink) or 3–4 year only (green) in the single cell data for S166–180-specific (top), S751–765-specific (middle) and S866–880-specific (bottom) clones. d Luminex assay results showing the expression of ten cytokines released by S751–765-specific clones split by whether the clones have a TCRα clonotype found at both timepoints (n = 13) or only found at 1–3 months (n = 11). Y-axis corresponds to log10[concentration (pg/ml) + 0.1]. Boxplots represent the 25th and 75th percentiles with the median marked with whiskers at ±1.5*IQR. The Wilcoxon signed-rank test was used for comparison between groups, and two-sided p values were calculated.
Fig. 5
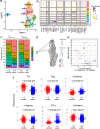
Fig. 5. scRNA-seq transcriptomic comparison of spike-specific CD4+ T cells at 1–3 months and 3–4 years.
a Uniform manifold approximation and projection (UMAP) visualisation of 2213 cells profiled ex vivo from PBMC samples. Cells are coloured based on their cluster occupancy. b Heatmap of the expression levels of the top differentially expressed genes for each cluster. c Stacked bar plots of the proportion of cells in each cluster split by timepoint. Shown here for S751–765- and S866–880-specific cells but not S166–180-specific cells due to the lack of S166–180-specific cells profiled at 1–3 months convalescence. d Milo analysis of differentially abundant cell clusters between 1–3 months and 3–4 years convalescence. Plot represents the embedding of the Milo differential abundance, where each node is a neighbourhood and node size is proportional to the number of cells in that neighbourhood. Colours represent the level of differential abundance. e Beeswarm plot showing the cell abundance changes between 3–4 years and 1–3 months convalescence. Neighbourhoods overlapping the same Seurat cluster identified in (a) are grouped together and neighbourhoods exhibiting significant differential abundance are coloured in red (higher at 1–3 months) or blue (higher at 3–4 years). f Boxplots comparing module scores for cells from 1–3 months (n = 634 cells) and 3–4 years (n = 1579 cells) convalescence. Boxplots represent the 25th and 75th percentiles with the median marked with whiskers at ±1.5*IQR. Wilcoxon signed-rank test was used to compare between groups and two-sided p values calculated.
Fig. 6
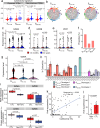
Fig. 6. Investigation of the CD4+ cytotoxicity signature in spike-specific cells at 3–4-year follow-up.
a Boxplots comparing the cytotoxicity signature of cells at 1–3 months (red) and 3–4 years (blue) convalescence for S751–765- and S866–880-specific cells, split by whether cells have a dominant TCRα clonotype or not (n = 49 [1–3 months] and 48 [3–4 years] cells for S751–765-specific cells with dominant TCRα; n = 33 [1–3 months] and 34 [3–4 years] cells for S866–880-specific cells with dominant TCRα; n = 101 [1–3 months] and 110 [3–4 years] cells for S751–765-specific cells with non-dominant TCRα; n = 166 [1–3 months] and 104 [3–4 years] cells for S866–880-specific cells with non-dominant TCRα). b Circos plots highlighting the clusters that share TCRα clonotypes found in cluster 7 (CD4+ CTL cluster). ce Violin plots comparing the expression of GZMA (c), GZMB (d) and PRF1 (e) in cells between 1–3 months (red) and 3–4 years (blue). f Proportion of 3–4-year epitope-specific cells in the cytotoxic T cell cluster (CTL) compared to all other clusters (non-CTL). g Violin plots comparing the expression of GZMA in cells at 3–4 years between the three epitope-specific cells. h Cytotoxicity of S166–180-, S751–765- and S866–880-specific T cell clones with the different TCR clonotypes. Each bar represents an individual T cell clone, and different coloured bars represent different clonotypes (3T cell clones with S166-180 clonotype 1 and 2 clones with clonotype 2; 4 clones with S751–765 clonotype 1; 12 clones with S866–880 clonotype 1, and 2 clones with clonotype 2), plotted as median±IQR. i, j Boxplots comparing the expression of GZMA and GZMB in cytotoxic (n = 3 clones in triplicates) and non-cytotoxic (n = 2 clones in triplicates) CD4+ T cell clones using bulk RNAseq (i) and bulk proteomics (j). k Correlation of virus suppression with T cell clone cytotoxicity (n = 98, including 33 S166–180-, 30 S751–765- and 35 S866–880-specific CD4+ T cell clones). l Comparison of virus suppression between S866–880-specific CD4+ cytotoxic (n = 21) and non-cytotoxic clones (n = 14), plotted as median ± IQR. The Wilcoxon signed-rank test was used to compare between groups (a, cg, l), while a paired Wilcoxon signed-rank test was used for the bulk RNAseq and proteomic analysis in (i, j). Two-sided p values were calculated for all Wilcoxon signed-rank tests. Correlation analysis was carried out using Spearman’s correlation. All boxplots (a, j, i) represent the 25th and 75th percentiles with the median marked with whiskers at ±1.5*IQR.

References

    1. Rydyznski Moderbacher, C. et al. Antigen-specific adaptive immunity to SARS-CoV-2 in acute COVID-19 and associations with age and disease severity. Cell183, 996–1012 e1019 (2020). - PMC - PubMed
    1. Zhou, R. et al. Acute SARS-CoV-2 infection impairs dendritic cell and T cell responses. Immunity53, 864–877 e865 (2020). - PMC - PubMed
    1. Bergamaschi, L. et al. Longitudinal analysis reveals that delayed bystander CD8+ T cell activation and early immune pathology distinguish severe COVID-19 from mild disease. Immunity54, 1257–1275 e1258 (2021). - PMC - PubMed
    1. Tan, A. T. et al. Early induction of functional SARS-CoV-2-specific T cells associates with rapid viral clearance and mild disease in COVID-19 patients. Cell Rep.34, 108728 (2021). - PMC - PubMed
    1. Notarbartolo, S. et al. Integrated longitudinal immunophenotypic, transcriptional and repertoire analyses delineate immune responses in COVID-19 patients. Sci. Immunol.6, eabg5021 (2021). - PubMed

Substances