

Predictive mapping of deep soil organic carbon stocks across land use systems in Southern assam, India
- PMID: 41034438
- PMCID: PMC12489057
- DOI: 10.1038/s41598-025-16355-0
Predictive mapping of deep soil organic carbon stocks across land use systems in Southern assam, India
Abstract
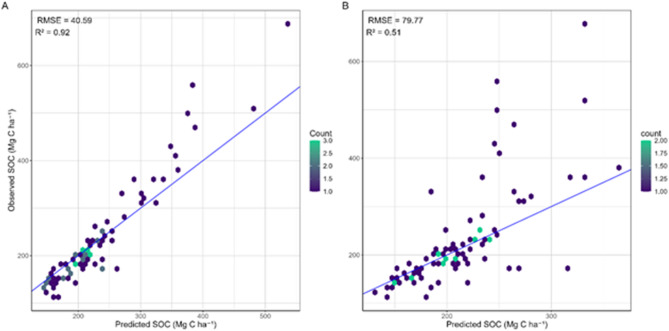
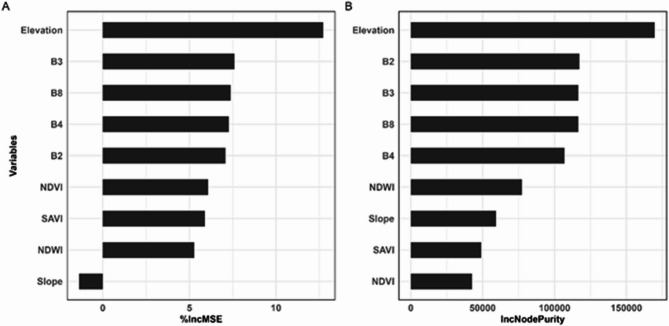
Deep soil organic carbon (SOC) is a critical component of the global carbon cycle; consequently, researchers have shown increasing interest in digital soil mapping (DSM) in recent years. Globally, several studies have used geospatial technology and machine-learning models to predict the spatial distribution of SOC stock. However, similar work is lacking in India and most of the previous studies are focused mainly up to 100 cm of soil depth and data on deep SOC stock is lacking. Therefore, the present study aims to evaluate different machine-learning algorithms for predicting deep SOC stock (up to 5 m of soil depth) of different land use systems, to identify the variable importance in predicting deep SOC stock, and to compute the pedologic deep SOC stock for diverse land uses in southern Assam, India. The SOC stock of five land use systems, including forested areas, open forest, tea agroforestry, other plantations (such as rubber, bamboo, and traditional agroforestry systems), and agricultural lands, was evaluated. A total of 86 pits were excavated across all the different land use systems and a total of 6,450 samples were collected for the analysis. Furhtermore, Sentinal-2 imegary was obtained for March 2025, as post monsoon season offers reduced cloud cover, enhanced visibility of land features, improved vegetation monitoring, and consistent data acquisition. The findings of the present study indicate that the Random Forest (RF) model performs better than the Support Vector Machine (SVM) model, as evidenced by a higher R² value of 0.92 and a lower RMSE of 40.59 Mg C ha⁻¹. Furthermore, the variable analysis has shown that elevation is the key factor in influencing the prediction of the spatial distribution of deep soil organic carbon across the region. The RF model predicted the lowest SOC stock of 147.78 Mg C ha- 1 in agricultural areas and the highest in forested areas (483.43 Mg C ha- 1). The model has predicted that the total SOC stored in the study area is 170.53 Teragrams (Tg), with the highest SOC stored in forested areas (76.79 Tg), followed by agricultural areas (33.26 Tg), while the lowest SOC stock was found in open forests (17.45 Tg). The present study identifies the region's temporal land use transitions, directly affecting regional carbon accounting and land management strategies. Furthermore, this research provides a critical basis for informed decision-making on sustainable land use, climate change mitigation, and soil conservation strategies in Northeast India, offering high-resolution spatial analysis of SOC pools.
Keywords: Carbon budgeting; Machine-learning; Random forest; Sentinel-2; Support vector machine.
© 2025. The Author(s).
Conflict of interest statement
Competing interests: The authors declare no competing interests.
Figures


References
-
- Bhunia, G. S., Shit, P. K. & Pourghasemi, H. R. Soil organic carbon mapping using remote sensing techniques and multivariate regression model. Geocarto Int.34, 215–226. 10.1080/10106049.2017.1381179 (2019).
-
- Emadi, M. et al. Predicting and mapping of soil organic carbon using machine learning algorithms in Northern Iran. Remote Sens.12, 2234. 10.3390/rs12142234 (2020).
-
- Stockmann, U. et al. The knowns, known unknowns and unknowns of sequestration of soil organic carbon. Agric. Ecosyst. Environ.164, 80–99. 10.1016/j.agee.2012.10.001 (2013).
-
- Button, E. S. et al. Deep-C storage: biological, chemical and physical strategies to enhance carbon stocks in agricultural subsoils. Soil Biol. Biochem.170, 108697. 10.1016/j.soilbio.2022.108697 (2022).
LinkOut - more resources
Full Text Sources
Research Materials
Miscellaneous
