. 2025 Oct 1;23(1):1033.
doi: 10.1186/s12967-025-06961-x.

Discovery of therapeutic AGC2 modulators by combining docking, binding, and vesicle-based transport assays

Affiliations

Discovery of therapeutic AGC2 modulators by combining docking, binding, and vesicle-based transport assays

Lucas Cafferati Beltrame et al. J Transl Med. .

Abstract

Backgroud: The mitochondrial Aspartate/Glutamate Carrier 2 (AGC2), encoded by the SLC25A13 gene, plays a critical role in cellular metabolism and redox balance through the malate/aspartate shuttle. Dysregulation of AGC2 is implicated in rare genetic diseases and tumorigenesis, making it a promising therapeutic target.

Methods: In this study, we developed the first integrative platform for the discovery and validation of high-affinity AGC2 modulators, combining in silico screening with biophysical and functional assays. Docking-based virtual screening of chemical libraries was employed to identify candidate inhibitors. Their binding and inhibitory activity were validated via a combination of thermal shift assays and isothermal titration calorimetry (ITC) performed on n-dodecyl-β-D-maltoside (DDM)-based vesicles reconstituted with AGC2, alongside functional transport assays using AGC2-containing proteoliposomes.

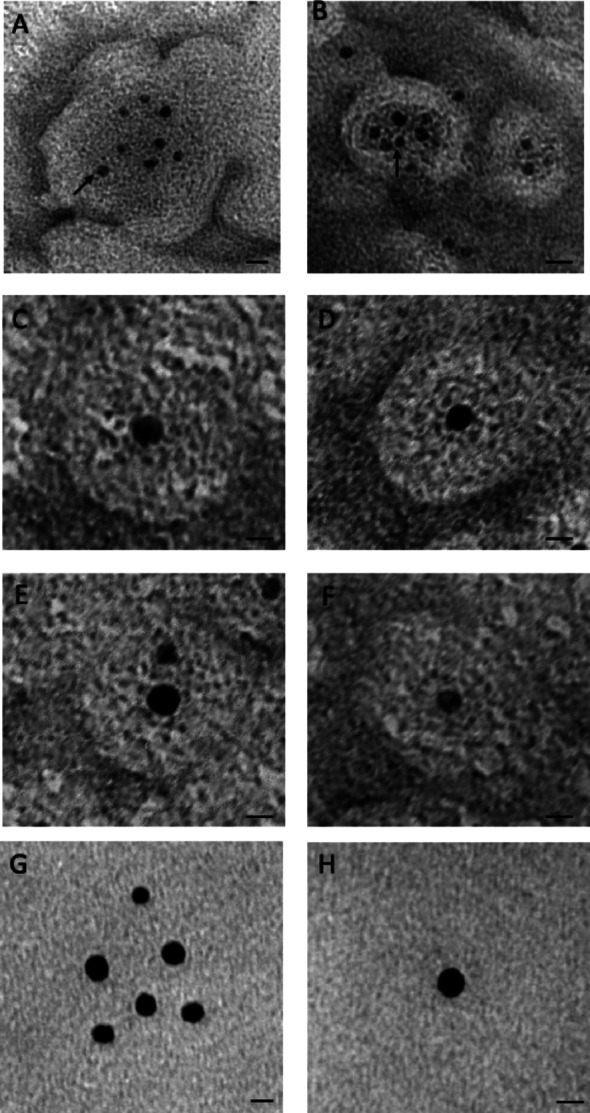
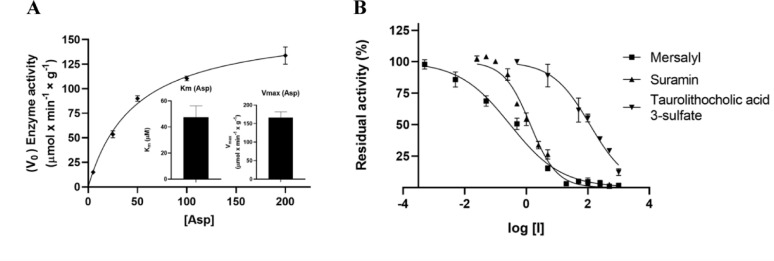
Results: We identified two previously unreported AGC2 inhibitors, suramin and taurolithocholic acid 3-sulfate. Remarkably, we report the first successful application of ITC to AGC2, overcoming major experimental challenges associated with ITC assays on the SLC25A family members, and achieving greater stability and reproducibility compared to similar assays performed on other family members, such as the ADP/ATP carrier and uncoupling proteins. Additionally, we present the first transmission electron microscopy (TEM) characterization of proteoliposomes and DDM-based vesicles reconstituted with AGC2, providing direct structural insights into the systems used for biophysical analysis.

Conclusions: This study establishes a reproducible, and scalable workflow that bridges high-throughput ligand identification with high-resolution kinetic characterization for targeting mitochondrial carriers.

Keywords: Aralar, SLC25A12 (Aspartate/glutamate carrier paralog 1); Aspartate/glutamate carrier (AGC); Citrin, SLC25A13 (Aspartate/glutamate carrier paralog 2); Isothermal titration calorimetry; Mitochondrial carrier; Mitochondrial carrier inhibitors; Mitochondrial transporter; SLC25A family; Thermostability shift assay; Transmission electron microscopy; Virtual screening.


Conflict of interest statement

Declarations. Ethics approval and consent to participate: Not applicable. Consent for publication: Not applicable. Competing interests: The authors declare no conflicts of interest.

Figures

Fig. 1
Fig. 1
Bacterial expression and purification of AGC2 inclusion bodies. AGC2 inclusion bodies and reconstituted proteins (DDM-AGC2, FPLC-AGC2, PL-AGC2) were separated by SDS-PAGE and stained with Comassie Blue dye. Molecular weight (MW) markers are indicated on the right. A) E. coli BL21 (DE3) containing the expression vector without (lane 1) and with (lane 2) the coding sequence of AGC2. Sample was taken immediately before (lane 1) and 5 h after induction (lane 2) from bacterial extracts. B) Purified AGC2 recombinant protein as inclusion bodies (IBs) (lane 3); AGC2 solubilized protein (lane 4); AGC2 in DDM-based vesicles (DDM-AGC2) (lane 5); AGC2 in DDM-based vesicles after FPLC purification (FPLC-AGC2) (lane 6). C) AGC2 proteoliposomes (PL-AGC2) (lane 7)
Fig. 2
Fig. 2
Kinetics of [14C]Asp transport in proteoliposomes reconstituted with AGC2 (PL-AGC2). Uptake of [14C]Asp. 0.1 mM [14C]Asp was added to proteoliposomes containing 20 mM Glu (heteroexchange, ●) or 10 mM NaCl and no substrate (uniport, ♦). Indicated values are the means of at least three independent experiments
Fig. 3
Fig. 3
Transmission electron micrographs of immunogold labelling of PL-AGC2 (A, B, C) and protein-free liposomes (D, E, F). Recognition of protein binding sites (black arrow) is identified by colloidal gold particles (B, C). The controls are not labelled: in A the primary antibodies are omitted; (D, E, F) are the samples without the protein; (C, F) are without staining for a better visualization of the gold particles. The absence of the dye allows easier identification of the gold binding site on AGC2, as there is no visual interference from the structure of the liposome. Bar = 20 nm
Fig. 4
Fig. 4
Transmission electron micrographs of immunogold labelling of PL-AGC2. Recognition of protein binding sites (black arrow) is identified by the black spot of the colloidal gold particles. G and H are without staining for a better visualization of the gold particles. The absence of the dye allows easier identification of the gold binding site on AGC2, as there is no visual interference from the structure of the liposome. Bar = 20 nm
Fig. 5
Fig. 5
Transmission electron micrographs of immunogold labelling of DDM-AGC2 (A, B, C), Amb-AGC2 (D, E, F), FPLC-AGC2 (G, H, I) and protein-free DDM-vesicles (L, M, N). Recognition of protein binding sites (black spots) is identified by colloidal gold particles (B, C, E, F, H, I). The controls are not labelled: in (A, D, G and L) the primary antibodies are omitted; (L, M, N) are the samples without the protein; C, F, I and N are without staining for a better visualization of the gold particles. The absence of the dye allows easier identification of the gold binding site on AGC2, as there is no visual interference from the structure of the detergent vesicle. Bar = 20 nm
Fig. 6.
Fig. 6.
3D comparative model of AGC2 protein. Panel A shows the lateral view of the AGC2 protein. The N-terminal region (residues 1–324) is shown in cartoon representation and contains 8 EF-hands (EF1–EF8) each consisting of an helix pair alternatively colored in grey and light orange. Two little helices in the N-terminal region are colored in black and do not participate to EF-hands. The C-terminal domain is shown in cartoon representation and contains the transmembrane transport domain (residues 325–605) and a further C-terminal region (residues 606–675, here not shown). The transmembrane transport domain consists of six transmembrane helices (H1–H6) and three little helices approximately perpendicular to the transmembrane H1–H6 bundle. Calcium ion is shown as a red bead. Panel B shows the top view of the AGC2 transmembrane transport domain (H1–H6). Aspartate (Asp) substrate is shown in magenta sticks. R492, D493, R585 and R588 involved in the binding of aspartate are shown in white spheres. Panels C-F Residues within 4 Å from Aspartate (panel C, magenta sticks), mersalyl (panel D, orange sticks), taurolithocholic acid 3-sulfate (panel E, blue sticks), and suramin (panel F, light brown sticks) are shown in white sticks, according to the best poses obtained by our docking screening
Fig. 7
Fig. 7
Free energy of binding (LE_LC, expressed in kcal/mol) calculated by autodock for the selected 3 molecules. The LE_LC (namely the energy of the Lowest Energy conformation in the Largest Cluster identified along autodock runs) for the docking of L-aspartate in SLC25A13_AGC2 is shown in green characters. Free energy of binding together with ligand efficiency, number of heavy atoms (hydrogens are excluded from this count) and number of torsions are reported for each investigated molecule. 2D structures of the assayed ligands are also shown
Fig. 8
Fig. 8
Inhibition of the rate of [14C]Asp uptake in presence of Mersalyl, Suramin, Taurolithocholic acid 3-sulfate. AGC2-reconstituted liposomes were preloaded internally with 20 mM Glu. Panel A. Enzymatic activity of recombinant‐purified AGC2 measured using transport assays in proteoliposomes at different concentrations of external [14C]Asp (♦; 5, 25, 50, 100, 200 μM). Michaelis–Menten (MM) constant Km and maximum activity rate Vmax of the recombinant‐purified AGC2 are reported in the left and right inserts, respectively. MM parameter estimations were conducted in GraphPad Prism. Data are presented as mean ± SEM of at least three independent experiments. Panel B. Determination of Mersalyl, Suramin, Taurolithocholic acid 3-sulfate IC50: transport was initiated by adding 1 mM [14C] Asp together with increasing external concentration of Mersalyl (■; 0.0005, 0.005, 0.05, 0.5, 5, 20, 50, 100, 250, 500, and 1000 μM), Suramin (▲; 0.025, 0.05, 0.1, 0.25, 1, 2.5, 5, 10, 100, 250, 500, 1000 μM) and Taurolithocholic acid 3-sulfate (▼; 0.5, 5, 50, 100, 250, 500, 1000 μM). The reaction time was 1 min. The residual transport activity (%) in presence of each inhibitor results from the average of at least three independent experiments
Fig. 9
Fig. 9
Inhibitor/substrate-carrier interactions induce specific thermostability shifts with DDM-AGC2 vesicles. The difference in melting temperature (ΔTm) is calculated by subtracting the apparent melting temperature in the absence of compound from the one in its presence. The effect on stability of all compounds was determined at A 0.1 mM, B 1 mM and C 3 mM. Individual melting curves (upper panels) and first order derivatives (lower panels) of D L-aspartate, E suramin, F taurolithocholic acid 3-sulfate, G mersalyl, which significantly altered the thermostability of the AGC2 protein, are shown. Control tests are those performed in absence of molecules (black line). Tests with 0.1 mM compound (blue line), 1 mM compound (red line) and 3 mM compound (green line) are reported in panels D-G. Statistical analysis: one-way ANOVA with Dunnett’s post hoc analysis to compare values to control *p < 0.5; **p < 0.01; ***p < 0.001; ****p < 0.0001. Mean ± SEM; n = 4 biologically independent experiments. Fluorescence intensity is shown as a direct readout of protein unfolding, in line with established CPM-based assays [–25], to avoid assumptions required for calculating unfolded fractions
Fig. 10
Fig. 10
Representative isothermal titration calorimetry of FPLC purified AGC2 protein binding to suramin, mersalyl and taurolithocholic acid 3-sulfate. On the top the raw data: each peak corresponds to the injection of 2 ml of the indicated ligand into the reaction cell containing the FPLC-AGC2 protein. On the bottom corresponding isotherms fitted to one-site binding model with ΔH, KD, ΔG, TΔS and stoichiometry as fitting parameters. Data fitting yields KD = 7.58 ± 3.17 µM for suramin (Error is given as s.d. for n = 3; KD = 7.25 µM, KD = 10.9 µM, KD = 4.58 µM; see Table 1); KD = 11.85 ± 4.62 nM for mersalyl (Error is given as s.d. for n = 3; KD = 11.1 nM, KD = 16.8 nM, KD = 7.65 nM, see Table 1); KD = 100.73 ± 8.97 µM for taurolithocholic acid 3-sulfate (Error is given as s.d. for n = 3; KD = 109 µM, KD = 91.2 µM, KD = 102 µM, see Table 1)

References

    1. Pierri CL, Palmieri F, De Grassi A. Single-nucleotide evolution quantifies the importance of each site along the structure of mitochondrial carriers. Cell Mol Life Sci. 2014;71:349–64. - PMC - PubMed
    1. Palmieri F, Pierri CL. Mitochondrial metabolite transport. Essays Biochem. 2010;47:37–52. - PubMed
    1. Saraste M, Walker JE. Internal sequence repeats and the path of polypeptide in mitochondrial ADP/ATP translocase. FEBS Lett. 1982;144:250–4. - PubMed
    1. Palmieri F, Pierri CL. Structure and function of mitochondrial carriers—role of the transmembrane helix P and G residues in the gating and transport mechanism. FEBS Lett. 2010;584:1931–9. - PubMed
    1. Giangregorio N, Pierri CL, Tonazzi A, Incampo G, Tragni V, De Grassi A, et al. Proline/Glycine residues of the PG-levels guide conformational changes along the transport cycle in the mitochondrial carnitine/acylcarnitine carrier (SLC25A20). Int J Biol Macromol. 2022;221:1453–65. 10.1016/j.ijbiomac.2022.09.135. - PubMed

LinkOut - more resources