. 2025 Oct 1;22(1):315.
doi: 10.1186/s12985-025-02928-y.

Human endogenous retrovirus ERVK3-1 characterizes a metabolically active and immunosuppressive subtype of liver cancer

Affiliations

Human endogenous retrovirus ERVK3-1 characterizes a metabolically active and immunosuppressive subtype of liver cancer

Xiaofen Wen et al. Virol J. .

Abstract

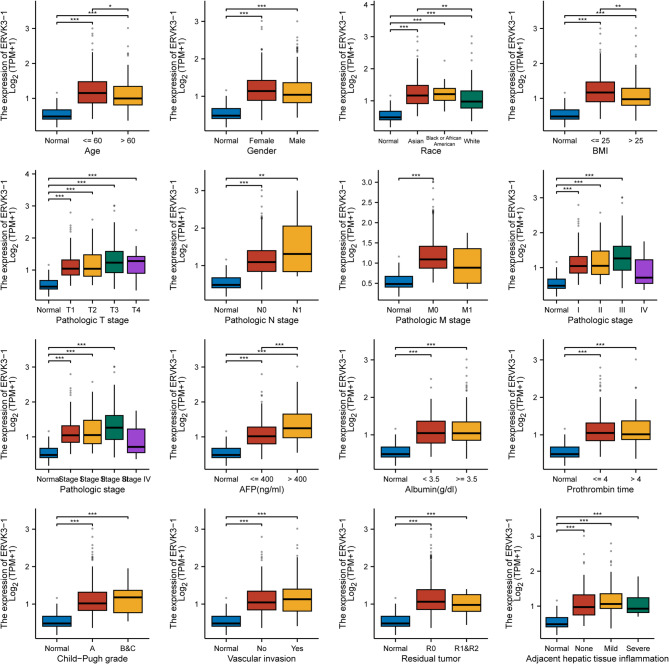
Background: Human endogenous retroviruses (HERVs), particularly the HERV-K family, are increasingly recognized for their roles in cancer biology, yet the function of ERVK3-1 (HERVK_3p21.31) in liver hepatocellular carcinoma (LIHC) remains largely unexplored.

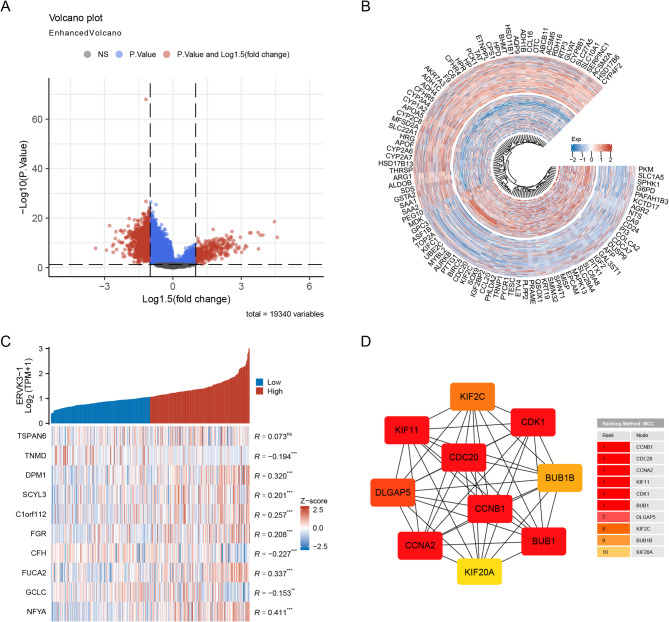
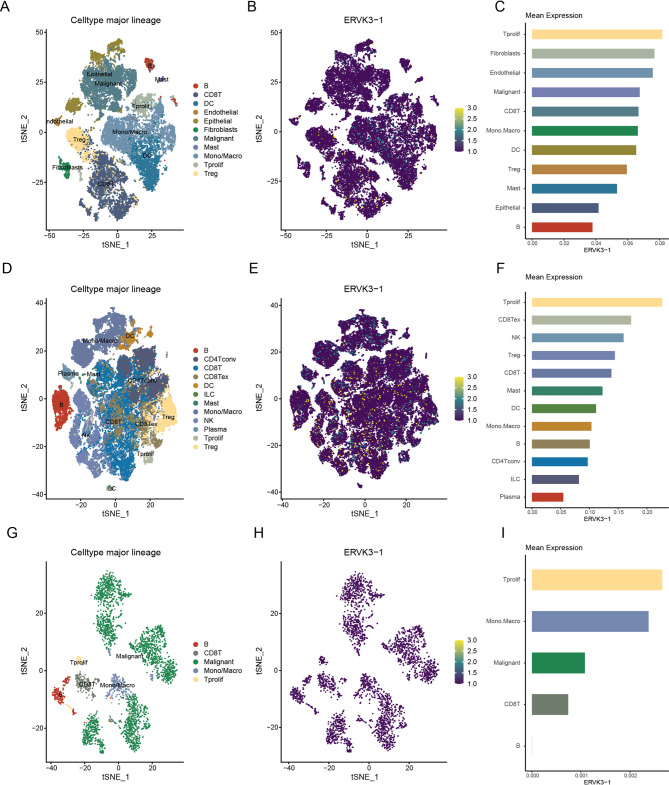
Methods: We analyzed transcriptomic data from the TCGA-LIHC cohort to identify differentially expressed genes (DEGs) between high and low ERVK3-1 expression groups, followed by functional enrichment analyses (GO, KEGG, GSEA), protein-protein interaction (PPI) network construction, and hub gene identification. The immunological relevance of ERVK3-1 was assessed through TIP immune cycle analysis, single-cell RNA sequencing datasets, and correlation with immune checkpoint expression. Immunotherapy responsiveness was evaluated using TIDE and TCIA databases.

Results: High ERVK3-1 expression was associated with enrichment in metabolic and oxidative stress-related pathways, while low expression correlated with cell cycle and DNA replication. PPI analysis revealed mitosis-related hub genes (e.g., CCNB1, CDK1). ERVK3-1 expression promoted early immune cell recruitment but was inversely correlated with later stages of the cancer immunity cycle, including immune infiltration and T-cell killing. Single-cell data showed high ERVK3-1 expression in immunosuppressive subsets, alongside positive associations with inhibitory immune checkpoints (e.g., PD-1, CTLA-4, TIM-3). High ERVK3-1 expression also correlated with greater immune evasion and reduced immunotherapy responsiveness.

Conclusions: ERVK3-1 plays a multifaceted role in LIHC progression, contributing to metabolic reprogramming, immune suppression, and resistance to immunotherapy. These findings highlight ERVK3-1 as a potential prognostic biomarker and therapeutic target in liver cancer.

Keywords: ERVK3-1; Immunotherapy; Liver hepatocellular carcinoma; T-cell exhaustion; Tumor microenvironment.


Conflict of interest statement

Declarations. Ethics approval and consent to participate: Not applicable. Consent for publication: Not applicable. Competing interests: The authors declare no competing interests.

Figures

Fig. 1
Fig. 1
Expression of ERVK3-1 across pan-cancer types, including LIHC. (A) ERVK3-1 expression levels across various tumor types compared to their corresponding normal tissues in TCGA (unpaired analysis). (B) ERVK3-1 expression in paired tumor and adjacent normal tissues in TCGA. (C) Kaplan-Meier analysis of overall survival based on ERVK3-1 expression in different tumor types in TCGA. (D) ROC curve evaluating the diagnostic performance of ERVK3-1 in distinguishing LIHC from normal liver tissues in TCGA. (E) Comparison of ERVK3-1 expression in normal liver tissues versus LIHC tissues from combined TCGA and GTEx datasets (non-paired). (F) Paired analysis of ERVK3-1 expression in LIHC tumor samples and matched adjacent normal tissues in TCGA. (G) Quantitative real-time PCR analysis comparing ERVK3-1 expression between the normal hepatic cell line THLE2 and hepatocellular carcinoma cell lines Huh7 and HepG2. Data are presented as mean ± standard error of the mean (SEM). TCGA, The Cancer Genome Atlas; GTEx, Genotype-Tissue Expression Project. *P < 0.05, **P < 0.01, ***P < 0.001. ns, not significant
Fig. 2
Fig. 2
Associations between ERVK3-1 expression and clinicopathological characteristics. Data shown for age, gender, race, BMI, T stage, N stage, M stage, pathologic stage, histological grade, AFP, albumin, prothrombin time, Child-Pugh grade, vascular invasion, residual tumor, and adjacent hepatic tissue inflammation. BMI, Body Mass Index; AFP, Alpha-Fetoprotein. *P < 0.05, **P < 0.01, ***P < 0.001
Fig. 3
Fig. 3
Prognostic value of ERVK3-1 in LIHC patients. (A–C) Kaplan-Meier analysis of overall survival, disease-specific survival, and progression-free interval in LIHC patients with high vs. low expression of ERVK3-1. (D) Forest plot based on multivariate Cox analysis for overall survival. ROC, Receiver Operating Characteristic; HR, Hazard Ratio; CI, Confidence Interval
Fig. 4
Fig. 4
Nomogram and calibration curves to predict 1-, 3-, and 5-year overall survival rates in LIHC patients. (A) Nomogram for predicting 1-, 3-, and 5-year overall survival rates. (B-D) Calibration curves for the nomogram’s prediction of 1- (B), 3- (C), and 5-year (D) overall survival rates in LIHC patients. (E) Time-dependent ROC curve analysis for the measures in the nomogram, ordered by their applicability to 1-, 3-, and 5-year survival predictions
Fig. 5
Fig. 5
ERVK3-1-related DEGs and PPI network analysis in LIHC. (A) Volcano plot of DEGs, with red points indicating significant upregulation and blue points indicating significant downregulation based on fold change and p-value thresholds. (B) Heatmap displaying the top 50 upregulated and top 50 downregulated genes with the greatest differential expression. (C) Heatmap of the correlation between ERVK3-1 expression and the top 10 DEGs. (D) Top 10 hub genes in ERVK3-1 expression-associated DEGs. Red to yellow, higher to lower rank. DEGs, Differentially Expressed Genes; PPI, Protein-Protein Interaction
Fig. 6
Fig. 6
GO, KEGG, and GSEA analysis of ERVK3-1 in LIHC. GO analysis of DEGs for upregulated genes (A) and downregulated genes (C). KEGG analysis of DEGs for upregulated genes (B) and downregulated genes (D). GSEA analysis of GO (E) and KEGG (F) gene sets from MSigDB. GO, Gene Ontology; KEGG, Kyoto Encyclopedia of Genes and Genomes; GSEA, Gene Set Enrichment Analysis; DEGs, Differentially Expressed Genes; bp, Biological Process; mf, Molecular Function; cc, Cellular Component; MSigDB, Molecular Signatures Database; NES, Normalized Enrichment Score
Fig. 7
Fig. 7
Correlation of ERVK3-1 expression with immune infiltration levels in LIHC. (A, B) Correlation between ERVK3-1 expression and the relative abundance of various immune cells by ssGSEA (A) and Cibersort (B) methods. The size of the dot corresponds to the absolute Spearman’s correlation coefficient values. (C, D) Correlation between chemokines (C) and interleukin cytokines (D) and ERVK3-1 expression. (E) TIP analysis for calculating immune activity scores at each step. The heatmap represents correlation analysis of immune scores, with blue indicating positive correlation and red indicating negative correlation. Circle size represents the strength of the correlation. In the schematic, the red line indicates a negative correlation between ERVK3-1 expression and immune score, while the green line indicates a positive correlation. Th17 cells, T-helper 17 cells; DC, Dendritic Cells; Tgd, T γδ cells; TReg, Regulatory T cells; NK cells, Natural Killer Cells; pDC, Plasmacytoid Dendritic Cell; iDC, Interdigitating Dendritic Cell; Tcm, Central Memory T Cells; Tem, Effector Memory T Cells; TFH, Follicular Helper T Cells. *P < 0.05, **P < 0.01, ***P < 0.001, ns, not significant
Fig. 8
Fig. 8
Single-cell expression analysis of ERVK3-1 in LIHC datasets. (A, D, G) t-SNE plots of single-cell clustering in (A) GSE16635, (D) GSE140228_10x, and (G) GSE14611, where different colors represent different cell types. (B, E, H) t-SNE plots of ERVK3-1 expression distribution in different cells at (B) GSE16635, (E) GSE140228_10x, and (H) GSE14611, where color intensity reflects expression abundance. Darker colors indicate lower expression, and brighter colors indicate higher expression. (C, F, I) Bar charts of ERVK3-1 expression abundance in different cells at (C) GSE16635, (F) GSE140228_10x, and (I) GSE14611. Mono/Macro, Monocytes/Macrophages; DC, Dendritic Cells; Treg, Regulatory T cells; CD8Tex, CD8 + T cell exhaustion; NK, Natural Killer cells; ILC, Innate Lymphoid Cells
Fig. 9
Fig. 9
ERVK3-1 expression and its relationship with LIHC immunotherapy. (A) Correlation between ERVK3-1 expression and immune checkpoint molecules. (B) Correlation between ERVK3-1 expression and markers of CD8 + T cell exhaustion (PDCD1 and HAVCR2), as well as key effector molecules (GZMB, GZMK, PRF1, and IFNG). (C) Relationship between ULBP2 expression and TIDE score. (D) Relationship between ULBP2 expression and IPS score in four IPS groups: ips_ctla4_neg_pd1_neg, ips_ctla4_neg_pd1_pos, ips_ctla4_pos_pd1_neg, and ips_ctla4_pos_pd1_pos. TIDE, Tumor Immune Dysfunction and Exclusion; IPS, Immune Phenotype Scores. *P < 0.05, **P < 0.01, ***P < 0.001

References

    1. Sung H, Ferlay J, Siegel RL, Laversanne M, Soerjomataram I, Jemal A, et al. Global cancer statistics 2020: GLOBOCAN estimates of incidence and mortality worldwide for 36 cancers in 185 countries. Cancer J Clin. 2021;71(3):209–49. - PubMed
    1. Ren Z, Xu J, Bai Y, Xu A, Cang S, Du C, et al. Sintilimab plus a bevacizumab biosimilar (IBI305) versus Sorafenib in unresectable hepatocellular carcinoma (ORIENT-32): a randomised, open-label, phase 2–3 study. Lancet Oncol. 2021;22(7):977–90. - PubMed
    1. Eggermont AMM, Blank CU, Mandala M, Long GV, Atkinson V, Dalle S, et al. Adjuvant pembrolizumab versus placebo in resected stage III melanoma. N Engl J Med. 2018;378(19):1789–801. - PubMed
    1. Cheng AL, Qin S, Ikeda M, Galle PR, Ducreux M, Kim TY, et al. Updated efficacy and safety data from IMbrave150: Atezolizumab plus bevacizumab vs. sorafenib for unresectable hepatocellular carcinoma. J Hepatol. 2022;76(4):862–73. - PubMed
    1. Ringelhan M, Pfister D, O’Connor T, Pikarsky E, Heikenwalder M. The immunology of hepatocellular carcinoma. Nat Immunol. 2018;19(3):222–32. - PubMed

MeSH terms

LinkOut - more resources