. 2025 Oct 1;44(1):278.
doi: 10.1186/s13046-025-03539-9.

High-throughput drug screening in advanced pre-clinical 3D melanoma models identifies potential first-line therapies for NRAS-mutated melanoma

Affiliations

High-throughput drug screening in advanced pre-clinical 3D melanoma models identifies potential first-line therapies for NRAS-mutated melanoma

Cristian Angeli et al. J Exp Clin Cancer Res. .

Abstract

Background: Despite significant advances in targeted (BRAFi + MEKi) and immune (anti-PD1/PD-L1, anti-CTLA4, and anti-LAG3) therapies, treatment options for NRASmut melanoma remain limited. Currently, NRASmut patients rely on immune checkpoint inhibitors, classical chemotherapy, and off-label MEK inhibitors, with over 50% experiencing rapid disease progression. One of the key challenges in developing effective targeted therapies is the lack of preclinical models that accurately recapitulate the tumor microenvironment (TME) and the intrinsic resistance of melanoma cells bearing NRAS mutations.

Methods: To address this, we performed high-throughput screening (HTS) of over 1,300 compounds in 3D NRASmut melanoma spheroids. A multi-step analysis was performed to identify hits, which were further tested by performing drug-response curve (DRC) analysis. Most promising compounds were further validated using mono- and co-culture 3D in vitro models that mimic three main metastatic sites in melanoma, such as skin/dermal, lung, and liver, utilizing spheroid and hydrogel systems. Ultimately, validation was conducted using zebrafish xenograft models to enable a more refined and accurate assessment of drug response.

Results: High-throughput drug screening of NRASmut melanoma spheroids identified 17 candidate compounds, which were subsequently validated through DRC analyses. Among the most promising drugs, Daunorubicin HCl (DH) and Pyrvinium Pamoate (PP) were selected for further investigation, demonstrating potent anti-melanoma activity in advanced 3D co-culture systems and zebrafish xenograft models. Notably, PP demonstrated higher cytotoxicity compared to Trametinib, the off-label MEK inhibitor, with an inhibitory effect on AKT and invasive behavior in the patient-derived metastatic melanoma cell lines. Additionally, combinatorial treatment with Trametinib resulted in additive effects on cell proliferation and viability. Importantly, both compounds showed similar efficacy in NRASmut and BRAFwt/NRASwt melanoma cell lines that were resistant to Trametinib (MEK inhibitor).

Conclusions: Using advanced 3D melanoma models that incorporate key TME elements and zebrafish xenograft models, this study highlights the potential of Daunorubicin HCl and Pyrvinium Pamoate as novel first-line therapies for NRASmut melanoma, with a noteworthy effect also on MEKi-resistant cells. These findings support drug repurposing strategies and underscore the importance of physiologically relevant preclinical models in identifying effective therapies.


Conflict of interest statement

Declarations. Ethics approval and consent to participate: All patient-derived melanoma cell lines derived from metastatic melanoma tumors (fresh or slow frozen) were obtained from the repository of Prof. Mitchell Levesque of the Department of Dermatology, University Hospital Zurich, Switzerland. The repository was established for the approved clinical study: BASEC: 2018–02050, 2018–02052, 2019 − 01326. The Zebrafish Facility at the University of Padova holds the authorization 407/2015-PR (OPBA), and the Zebrafish Core Facility at the Luxembourg Centre for Systems Biomedicine at the University of Luxembourg is registered as an authorized breeder, supplier, and user of zebrafish with Grand-Ducal Decree of 26 January 2023. All practices involving zebrafish complied with the European Legislation for the Protection of Animals used for Scientific Purposes (Directive 2010/63/EU) and following the principles of the 3Rs. Consent for publication: All the authors read and approved the final manuscript. Competing interests: The authors declare no competing interests.

Figures

Fig. 1
Fig. 1
High-Throughput Screening (HTS) allows the testing of hundreds of compounds on NRASmut melanoma 3D spheroids. A) Representation of the HTS workflow on SKmel147 melanoma spheroids. Melanoma cells were cultured in 384-well U-bottom ULA plates for 3 days. Drugs were dispensed using an acoustic liquid handler. After 5 days of treatment, staining and image acquisition were performed. B) Representative plate layout of HTS. The yellow box highlights the wells where drugs were dispensed; white boxes highlight the wells affected by the edge effect; blue and red boxes highlight the wells dedicated to DMSO 0.1% (vehicle/negative control) and Foretinib at 30 µM (positive control), respectively. C) Representative pictures of residual maximum intensity projection (MIP) used for segmentation and mask generation eliciting the Calcein AM fluorescent signal during high-content imaging analysis, and subsequent total spheroid area calculation. D) Z’-factors for each screened plate. A cut-off was set at 0.5. Libraries were distributed on five plates, with 2 replicates per drug. Plates 1 to 5 represent the first replicate, and plates 6 to 10 represent the second replicate of tested drugs. E) A cut-off of coefficients of variation (%) was set to 10% for each screened plate.
Fig. 2
Fig. 2
A multistep selection process identifies novel compounds for potential treatment of NRASmut melanoma. (A) Schematic representation of the multistep process of drug selection for subsequent drug-response curve (DRC) validation. DMSO-3STD: deviation of at least 3 standard deviations from the mean of DMSO control. (B) Scatter plots represent the total MIP Calcein AM area of a series of compounds screened. The left panel represents the first replicate, and the right panel represents the second replicate. The red dashed line indicates the plate-specific cut-off: only compounds that were below the cut-off in both replicates were selected (compound 1 here). Next to the scatter plots: confocal images of melanoma spheroids treated with either compound 1 or 2 in both replicates. (C) The pie chart represents the pathways targeted by the 17 selected hit compounds. D and E) Drug-response curves of Daunorubicin HCl and Pyrvinium Pamoate generated on four NRASmut melanoma cell lines (SKmel147, SKmel30, M160915 and M161022), utilizing CellTiter-Glo® 3D Cell Viability Assay as readout after 5 days of treatment. Reported IC50 values in the tables are mean (± SD) of 3 independent biological replicates.
Fig. 3
Fig. 3
Daunorubicin HCl and Pyrvinium Pamoate induce inhibition of proliferation and viability and trigger cytotoxic effects in SKmel147 spheroids. (A) Proliferation of SKmel147-mCherry spheroids treated for 5 days with indicated drugs. Fluorescent images depicting the spheroid area were acquired every 12 h. (n = 3, mean ± SD). (B) Cell viability of SKmel147-mCherry spheroids was assessed after 5 days of drug treatment. Data are normalized to the untreated control. Staurosporine was used as positive control at 200 nM in A and B. (n = 3, mean ± SD); (C) Representative pictures of apoptosis and cell death detection in SKmel147-mCherry spheroids that were treated with different compounds for 5 days. Staurosporine was used as positive control at 1µM. Apoptosis (green) and cell death (blue) were measured upon the addition of the CellEvent Caspase-3/7 and Sytox Blue detection reagents, respectively. Confocal images (20x magnification) of single spheroids are shown. Scale bar = 200 μm (n = 3). (D) Western blot of whole cell lysates from SKmel147 spheroids treated for 3 and 5 days with either Daunorubicin HCl (DH), Pyrvinium Pamoate (PP) or Trametinib (T). (E) Quantification of the total AKT and ERK protein levels in SKmel147, normalized to GAPDH. F-G) pERK/ERK and pAKT/AKT ratios respectively in SKmel147 spheroids. GAPDH was used as a loading control; Data were normalized by and to day-specific untreated controls. Representative blots of three biological replicates are shown. (H) Immunofluorescence (IF) staining of β-Catenin (green), nuclei (DAPI, blue), and F-Actin (Phalloidin, red); Bar plot shows quantification of the relative β-Catenin nuclear signal. (I) IF staining of γH2AX (green), nuclei (DAPI, blue), and F-Actin (Phalloidin, red); Bar plot shows quantification of the relative γH2AX nuclear signal. Cell-line specific IC50 drug concentrations were used for spheroid stimulations in the different assays. UT: untreated, STAU: Staurosporine. One sample T-test was used in B, F, G, H and I for statistical significance testing (ns = not significant, *p ≤ 0.05, **p ≤ 0.01, ***p ≤ 0.001, ****p ≤ 0.0001).
Fig. 4
Fig. 4
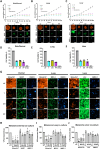
SKmel147-TME co-culture models show inhibitory melanoma-specific effect and low toxicity on non-cancerous cells. A-C) Upper panels: Kinetic response of SKmel147-mCherry co-cultures to 5-day drug treatment in 3 different Melanoma Multicomponent Spheroid (MMS) models: “Skin/Dermal” (A), “Lung” (B), and Liver” (C). Images of mCherry fluorescence were acquired every 12 h. The spheroid area was determined and plotted. Lower panels: corresponding confocal images (20x magnification) of the different cell populations after 5 days of drug treatment. Scale bar = 200 μm. (n = 3. mean ± SD) D-F) Cell viability of the 3 SKmel147-MMS models after 5 days of drug treatment. Data are normalized to untreated control. Staurosporine was used as positive control at 200 nM in A-F. (n = 3. mean ± SD). G) Representative confocal pictures (20x magnification) of 3 hydrogel-embedded SKmel147-TME co-culture models (“Dermal”, “Lung”, and Liver”) after 5-day treatment: SKmel147-mCherry (red), NHDF/MRC-5/LX-2 (green), HMEC-1 (blue). Scale bar = 200 μm. H-J) Plots representing the percentage of fluorescent area of the different cell populations in the 3 hydrogel co-culture models. Data are normalized to the untreated control of each specific cell population. One sample T-test was used for H-J for statistical significance testing (n = 3. mean ± SD; *p ≤ 0.05, **p ≤ 0.01). Melanoma cell line-specific IC50 concentrations of Daunorubicin HCl (DH), Pyrvinium Pamoate (PP) and Trametinib (T) were used.
Fig. 5
Fig. 5
Daunorubicin HCl and Pyrvinium Pamoate exert inhibitory and cytotoxic effect on Trametinib-resistant NRASmut melanoma cell lines. A-C) Representative drug response curves for Trametinib (MEKi) (A), Daunorubicin HCl (B) and Pyrvinium Pamoate (C) in Trametinib-sensitive (green) and -resistant (red) SKmel30 cells cultured as spheroids, utilizing CellTiter-Glo® 3D Cell Viability Assay as readout after 5 days of treatment. Reported IC50 values in the tables are mean ± SD of 3 independent biological replicates. Tres: Trametinib-resistant. D-E) Representative photos of apoptosis and cell death detection in SKmel30 (D) and SKmel30 T-res (E) spheroids after 5 days of treatment. Staurosporine was used as positive control at 1µM. Apoptosis (green) and cell death (blue) were measured upon the addition of the CellEvent Caspase-3/7 and Sytox Blue detection reagents, respectively. Confocal images (20x magnification) of single spheroids are shown. Scale bar = 200 μm (n = 3)
Fig. 6
Fig. 6
Daunorubicin HCl and Pyrvinium Pamoate show strong melanoma inhibitory effects in zebrafish xenograft models. Left panel: SKmel147-mCherry xenografts. Right panel: MelJuso-RES-mCherry xenografts. Skmel147-mCherry (A) and MelJuso-RES-mCherry cells (B) were injected into the yolk of 2dpf zebrafish and subjected to mono- or combinatory treatments. Scale bar: 500 μm. The xenograft area (C-D) and the number of cells per xenograft (E-F) were evaluated after 3 days of treatment based on the mCherry signal by two independent investigators. Graphs represent the mean ± SD of normalized data. Statistical significance was assessed with Shapiro-Wilk normality test followed by Kruskal Wallis test with Dunn’s multiple comparisons: ∗p < 0.05; ∗∗p < 0.01; ∗∗∗p < 0.001; ∗∗∗∗p < 0.00001. (G-H) Larvae viability was monitored daily over the course of the treatment. MelJuso-RES-mCherry cells: Binimetinib-resistant NRASmut melanoma cells.

References

    1. Long GV, Swetter SM, Menzies AM, Gershenwald JE, Scolyer RA. Cutaneous melanoma. Lancet. 2023;402(10400):485–502. - PubMed
    1. Shain AH, Bastian BC. From melanocytes to melanomas. Nat Reviews Cancer Nat Publishing Group. 2016;16:345–58. - PubMed
    1. Akbani R, Akdemir KC, Aksoy BA, Albert M, Ally A, Amin SB et al. Genomic Classification of Cutaneous Melanoma. Cell. 2015;161(7):1681–96. Available from: https://linkinghub.elsevier.com/retrieve/pii/S0092867415006340 - PMC - PubMed
    1. Boutros A, Croce E, Ferrari M, Gili R, Massaro G, Marconcini R et al. The treatment of advanced melanoma: Current approaches and new challenges. Crit Rev Oncol Hematol. 2024;196:104276. Available from: https://linkinghub.elsevier.com/retrieve/pii/S1040842824000192 - PubMed
    1. Fernandez MF, Choi J, Sosman J. New approaches to targeted therapy in melanoma. Cancers (Basel). 2023;15(12):3224. - PMC - PubMed