. 2025 Oct 1;20(1):103.
doi: 10.1186/s13024-025-00892-3.

Molecular hallmarks of excitatory and inhibitory neuronal resilience to Alzheimer's disease

Affiliations

Molecular hallmarks of excitatory and inhibitory neuronal resilience to Alzheimer's disease

Isabel Castanho et al. Mol Neurodegener. .

Abstract

Background: A significant proportion of individuals maintain cognition despite extensive Alzheimer's disease (AD) pathology, known as cognitive resilience. Understanding the molecular mechanisms that protect these individuals could reveal therapeutic targets for AD.

Methods: This study defines molecular and cellular signatures of cognitive resilience by integrating bulk RNA and single-cell transcriptomic data with genetics across multiple brain regions. We analyzed data from the Religious Order Study and the Rush Memory and Aging Project (ROSMAP), including bulk RNA sequencing (n = 631 individuals) and multiregional single-nucleus RNA sequencing (n = 48 individuals). Subjects were categorized into AD, resilient, and control based on β-amyloid and tau pathology, and cognitive status. We identified and prioritized protected cell populations using whole-genome sequencing-derived genetic variants, transcriptomic profiling, and cellular composition.

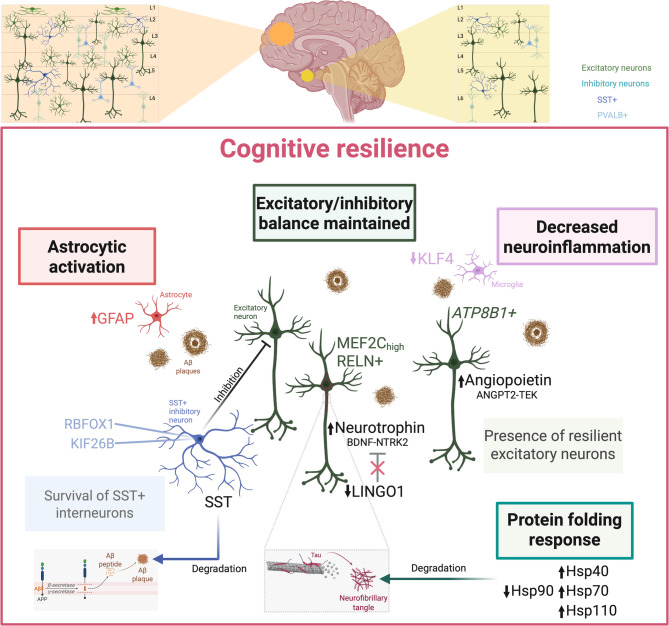
Results: Transcriptomics and polygenic risk analysis position resilience as an intermediate AD state. Only GFAP and KLF4 expression distinguished resilience from controls at tissue level, whereas differential expression of genes involved in nucleic acid metabolism and signaling differentiated AD and resilient brains. At the cellular level, resilience was characterized by broad downregulation of LINGO1 expression and reorganization of chaperone pathways, specifically downregulation of Hsp90 and upregulation of Hsp40, Hsp70, and Hsp110 families in excitatory neurons. MEF2C, ATP8B1, and RELN emerged as key markers of resilient neurons. Excitatory neuronal subtypes in the entorhinal cortex (ATP8B+ and MEF2Chigh) exhibited unique resilience signaling through activation of neurotrophin (BDNF-NTRK2, modulated by LINGO1) and angiopoietin (ANGPT2-TEK) pathways. MEF2C+ inhibitory neurons were over-represented in resilient brains, and the expression of genes associated with rare genetic variants revealed vulnerable somatostatin (SST) cortical interneurons that survive in AD resilience. The maintenance of excitatory-inhibitory balance emerges as a key characteristic of resilience.

Conclusions: We have defined molecular and cellular hallmarks of cognitive resilience, an intermediate state in the AD continuum. Resilience mechanisms include preserved neuronal function, balanced network activity, and activation of neurotrophic survival signaling. Specific excitatory neuronal populations appear to play a central role in mediating cognitive resilience, while a subset of vulnerable interneurons likely provides compensation against AD-associated hyperexcitability. This study offers a framework to leverage natural protective mechanisms to mitigate neurodegeneration and preserve cognition in AD.

Keywords: Alzheimer’s disease; Cognitive reserve; Cognitive resilience; E/I imbalance; Gene expression; Genetics; Rare variants; SST interneurons; Single-cell RNA sequencing; Transcriptomics; Vulnerability.


Conflict of interest statement

Declarations. Ethics approval and consent to participate: Detailed information regarding ethical approval and consent for the bulk RNAseq data [31, 32], snRNAseq data [19, 47], and whole-genome data [57] has previously been described. ROSMAP studies were approved by the Institutional Review Board of Rush University Medical Center. Whole genome sequencing studies were approved by the Institutional Review Board from Massachusetts General Hospital (protocols 2015P000111 and 2019P001879).Human brain tissue used for immunostaining experiments, collected at Beth Israel Deaconess Medical Center (BIDMC), was approved by the BIDMC Institutional Review Board (IRB Protocol 2023P000848). Consent for publication: Not applicable. Competing interests: Authors declare that they have no competing interests.

Figures

Fig. 1
Fig. 1
Transcriptomic signatures of cognitive resilience against AD pathology. (A) Overview of study design. Using levels of Aβ plaques and neurofibrillary tangles, and presence/absence of cognitive impairment, ROSMAP donors were classified into three major categories: Control (CTRL, CERAD “no AD”, Braak 0-II, and consensus cognitive diagnosis “no cognitive impairment”), Resilient (RES, CERAD “definite AD” or “probable AD”, Braak III-VI, and consensus cognitive diagnosis “no cognitive impairment”), and AD (CERAD “definite AD” or “probable AD”, Braak III-VI, and consensus cognitive diagnosis “Alzheimer’s dementia and no other cause of cognitive impairment”). (B) Volcano plots showing significantly (FDR-adj-P < 0.1) differentially expressed genes (DEGs) in AD compared to resilient individuals (ADvsRES), AD compared to controls (ADvsCTRL), and resilient compared to controls (RESvsCTRL). DEGs with log2FC < -log2(1.1) are highlighted in blue, and DEGs with log2FC > log2(1.1) are highlighted in red. The horizontal lines represent FDR-adjusted P-value = 0.1. Differential expression analysis performed implemented in the Limma package (moderated t-test). Statistical results are shown in Tables S1-S3. nAD = 187, nRES = 68, nCTRL = 44. Figure created in part with BioRender.com
Fig. 2
Fig. 2
Cell-specific transcriptomic signatures of cognitive resilience against AD pathology. (A) Brain regions analyzed. Created with BioRender.com. (B) Down-regulation of LINGO1 in cognitive resilience across different major cell types from each brain region (statistical results shown in Table S13). (C) Down-regulation of Hsp90 (heat shock protein 90) family members in cognitive resilience (statistical results shown in Table S13). (D-E) Protein-protein interaction (PPI) networks showing upregulation of members of the Hsp40, Hsp70, and Hsp110 families in resilient excitatory neurons. Molecular Complex Detection (MCODE) algorithm network clusters (modules) showing the subset of proteins that form physical interactions with at least one other member in the list, generated using Metascape. The protein networks were constructed based on physical interactions among all input gene lists. (D) PPI network analysis generated a single cluster from genes upregulated in excitatory neurons (DLPFC) in resilience compared to AD (ADvsRES). The three best-scoring terms by p-value from pathway and process enrichment analysis for this module were “chaperone cofactor-dependent protein refolding”, “‘de novo’ post-translational protein folding”, and “‘de novo’ protein folding” (Table S15). (E) Single PPI network cluster detected from genes upregulated in excitatory neurons (DLPFC) in resilience compared to controls (RESvsCTRL, Table S16). The three best-scoring terms by p-value from pathway and process enrichment analysis for this module were “chaperone cofactor-dependent protein refolding” (GO:0051085, Log10(P) = -13.2), “‘de novo’ post-translational protein folding” (GO:0051084, Log10(P) = -12.9), and “‘de novo’ protein folding” (GO:0006458, Log10(P) = -12.6). CTRL: Control, AD: Alzheimer’s disease, RES: Resilient. DLPFC: Dorsolateral prefrontal cortex, EC: Entorhinal cortex, HC: Hippocampus. P-values shown in B-C were derived from differential expression analysis performed using MAST in Seurat and adjusted using Bonferroni correction: * adj-P < 0.05, ** adj-P < 0.01, *** adj-P < 0.001. Log2FC, adj-P, and direction of change (first diagnostic group compared to the second group) shown in Table S13. Sample size distributions shown in Table S11
Fig. 3
Fig. 3
Inhibitory neurons as key players in protection against AD. (A) Brain regions shown in B-I. Created with BioRender.com. (B) UMAP embedding of inhibitory neurons from the EC (left) and DLPFC (right). Sample size distributions shown in Table S11. See Table S14 for detailed cluster annotations. (C-D) Cellular enrichment of genes annotated from protective rare variants in (C) major cell types (adj-P = 0.002) and (D) subtypes (adj-PInh1 = 0.08, adj-PInh10 = 0.007) of inhibitory neurons from the DLPFC, independently of diagnostic group. Expression-weighted cell type enrichment analysis performed using the R package EWCE, which calculates the probability of distribution of a gene list. Y-axis shows standard deviation from the bootstrapped mean. Stars denote Bonferroni-adjusted P-values (** adj-P < 0.01). (E-I) Distributions of cell proportion (top) and gene expression levels of marker genes (bottom) for the DLPFC SST+ (RBOFX1+ KIF26B+) Inh1 (E), SST+ MEF2Chigh Inh7 (F), and the EC SST+ Inh3 (G), SST+ Inh9 (I), and MEF2Chigh Inh0 (J) subpopulations. Stars shown in the box plots (cell proportions) reflect FDR-adjusted P-values from a Dirichlet multinomial regression model (Table S17), and in the violin plots (gene expression) refer to Bonferroni-adjusted P-values: * adj-P < 0.05, ** adj-P < 0.01, *** adj-P < 0.001
Fig. 4
Fig. 4
Excitatory neuronal subpopulations expressing MEF2C and ATP8B1 exhibiting resilient behavior. (A) Brain region shown in B-I. Created in part with BioRender.com. (B) UMAP plot showing the subclusters (‘subpopulations’) investigated in excitatory neurons from the EC, identified using the Harmony algorithm, in the ROSMAP cohort. Sample size distributions shown in Table S11. See Table S14 for detailed cluster annotations. (C-E) Cell proportion distributions (top) and gene expression levels of marker genes (bottom) for the MEF2Chigh ATP8B1+ RELN+ EC:Exc2 subpopulation (C), ATP8B1+ EC:Exc3 subpopulation (D), and MEF2Chigh RELN+ EC:Exc5 subpopulation (E). Stars shown in the box plots (cell proportions) reflect FDR-adjusted P-values from a Dirichlet multinomial regression model (Table S17), and in the violin plots (gene expression) refer to Bonferroni-adjusted P-values. (F-G) Protein staining in an independent cohort. Sample size distributions shown in Table S18. (F) Immunofluorescence representative pictures showing NeuN, RELN, MEF2C, ATP8B1, and Aβ in EC brain sections from a resilient subject. (G) Box plots showing cell proportion distributions for MEF2ChighATP8B1+ RELN+ (top; top left: positivity in non-nuclear compartments; top right: positivity in the nucleus), ATP8B1+ (bottom left), and MEF2Chigh RELN+ (bottom right) neurons (NeuN+), identified by immunostaining. The subcellular organization of protein markers (nucleus, cytoplasm, and membrane) was considered in downstream analysis, treating each compartment as an independent variable. Data-driven single-cell clustering resulted in three variables: for MEF2C: Nucleus, Membrane, and Cytoplasm. For one of the clusters expressing MEF2C, ATP8B1, and RELN, the intensity quantifications were similar for MEF2C-Membrane and MEF2C-Cytoplasm, but distinct for MEF2C-Nucleus, thus reported here separately (pExc2: cytoplasm + membrane; pExc2-N: nucleus). Stars reflect FDR-adjusted P-values from a Dirichlet multinomial regression model. Nsubjects = 17 (6 CTRL, 6 AD, 5 RES), Ncells = 81,549 (CTRL = 19,596, AD = 28,107, RES = 33,846) cells. (H-I) Chord diagrams displaying the neurotrophin (NT) signaling pathway (H) and angiopoietin (ANGPT) signaling pathway in EC cell subpopulations, predicted to change significantly (Figure S16) based on a cell-cell communication analysis of ligand-receptor interactions. * Adj-P < 0.05, ** Adj-P < 0.01, *** Adj-P < 0.001. CTRL: Control, AD: Alzheimer’s disease, RES: Resilient. DLPFC: Dorsolateral prefrontal cortex, EC: Entorhinal cortex, HC: Hippocampus
Fig. 5
Fig. 5
A functional model of resilience. Our model proposes that cognitive resilience is driven by the maintenance of the excitatory/inhibitory neuronal balance (dark green), sustained by resilient excitatory neurons expressing MEF2C and ATP8B1. These neurons engage in resilience-relevant signaling pathways, including neurotrophin (BDNF-NTRK2), modulated by the downregulation of LINGO1, and angiopoietin (ANGPT2-TEK). Protein folding and degradation processes are reorganized in resilience, with increased expression of Hsp40, Hsp70, and Hsp110 in excitatory neurons and downregulation of Hsp90, enhancing the degradation of pathological tau (mint green). SST+ inhibitory neurons, typically vulnerable in AD, are preserved in resilience, including subpopulations expressing RBFOX1 and KIF26B (blue), contributing to the balance of neuronal excitation. Additionally, SST release from these neurons promotes the degradation and clearance of pathological Aβ. In terms of glial response, resilience shows astrogliosis marked by increased GFAP in astrocytes (red), a feature shared with AD. However, it contrasts with AD by exhibiting a reduction or absence of microglial activation, characterized by decreased KLF4 expression, leading to reduced neuroinflammation (pink). Figure created with BioRender.com

Update of

References

    1. Arenaza-Urquijo EM, Vemuri P. Resistance vs resilience to alzheimer disease: clarifying terminology for preclinical studies. Neurology. 2018;90:695–703. - PMC - PubMed
    1. Aiello Bowles EJ, Crane PK, Walker RL, Chubak J, LaCroix AZ, Anderson ML, et al. Cognitive resilience to alzheimer’s disease pathology in the human brain. J Alzheimers Dis. 2019;68:1071–83. - PMC - PubMed
    1. Montine KS, Berson E, Phongpreecha T, Huang Z, Aghaeepour N, Zou JY, et al. Understanding the molecular basis of resilience to alzheimer’s disease. Front Neurosci. 2023;17:1311157. - PMC - PubMed
    1. Montine TJ, Cholerton BA, Corrada MM, Edland SD, Flanagan ME, Hemmy LS, et al. Concepts for brain aging: resistance, resilience, reserve, and compensation. Alzheimers Res Ther. 2019;11:22. - PMC - PubMed
    1. Arboleda-Velasquez JF, Lopera F, O’Hare M, Delgado-Tirado S, Marino C, Chmielewska N, et al. Resistance to autosomal dominant alzheimer’s disease in an APOE3 Christchurch homozygote: a case report. Nat Med. 2019;25:1680–3. - PMC - PubMed

Grants and funding

LinkOut - more resources