. 2025 Sep 17;17(5):plaf052.
doi: 10.1093/aobpla/plaf052. eCollection 2025 Oct.

Plant reproductive strategies and pollinator attributes differ in small-scale habitat heterogeneity

Affiliations

Plant reproductive strategies and pollinator attributes differ in small-scale habitat heterogeneity

Dongzhou Deng et al. AoB Plants. .

Abstract

Habitat variability critically influences plant reproductive strategies and pollinator attributes. However, studies on intraspecific variation in vegetative and floral traits, pollinator attributes, and seed traits remain limited in the context of small-scale habitat heterogeneity, particularly meadows interspersed with sandy patches. On the Tibetan Plateau, discrete sandy patches (some as small as 10 m2) occur within alpine meadows. We hypothesized that distinct plant reproductive strategies and pollinator attributes exist between meadows and sandy habitats at a microhabitat scale. To test this hypothesis, we conducted a field experiment to investigate variation in floral traits, pollinator attributes, and seed traits in a Tibetan alpine herb (Astragalus purpurinus) across meadow and sandy habitats. Our results show that meadow populations produced fewer nectar-enriched flowers with high sugar concentrations, fewer and larger seeds, and were pollinated primarily by bumble bees. In contrast, sandy-habitat populations produced numerous nectar-poor flowers with low sugar concentrations, more numerous small seeds, and relied on mason bees for pollination. Our results demonstrate that micro-scale habitat heterogeneity drives divergent plant reproductive strategies and pollinator attributes within a single species. These findings reveal novel mechanisms by which small-scale environmental variation shapes reproductive adaptation in alpine ecosystems.

Keywords: alpine meadow; bee behavior; land restoration; pollination; reproductive strategies.


Conflict of interest statement

Conflict of interest: None declared.

Figures
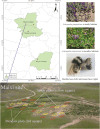
Figure 1.
Figure 1.
The figure shows the study sites and plant population and bee species of alpine meadows and sandy habitats. There were three sites, and each site included 10 meadow (red square) and 10 sandy plots (yellow square). Each plot was 2 m × 2 m. Totally, there were 3 sites, 60 plots, and 180 plants. Photo Credits: J. Mu
Figure 2.
Figure 2.
The violin plots show nectar volume per flower (a), nectar concentration (b), flower size (c), number of flowers per inflorescence (d), number of inflorescences per plant (e), and number of flowers per plant (f) of Astragalus purpurinus between alpine meadows and alpine sandy habitats. Violin plots show the density (width), interquartile range (hinges), and 1.5 times the interquartile range (adjacent lines). The line within the box represents the median of the responses, and the black star within the box represents the mean of the responses. Different letters above the boxes denote significant differences among treatments (P < 0.05).
Figure 3.
Figure 3.
The violin plots show visitation rates of bumble bees (a) and mason bees (b) of Astragalus purpurinus between alpine meadows and alpine sandy habitats. Violin plots show the density (width), interquartile range (hinges), and 1.5 times the interquartile range (adjacent lines). The line within the box represents the median of the responses, and the black star within the box represents the mean of the responses. Different letters above the boxes denote significant differences among treatments (P < 0.05).
Figure 4.
Figure 4.
The violin plots show seed mass (a), number of seeds per plant (b), seed set in nature (c), and seed set by supplementary pollen (d) of Astragalus purpurinus between alpine meadows and alpine sandy habitats. Violin plots show the density (width), interquartile range (hinges), and 1.5 times the interquartile range (adjacent lines). The line within the box represents the median of the responses, and the black star within the box represents the mean of the responses. Different letters above the boxes denote significant differences among treatments (P < 0.05).
Figure 5.
Figure 5.
The correlations between visitation rates and nectar volume per flower (a), visitation rates and nectar concentration (b), seed set and visitation rates (c), and seed mass and seed number per plant (d) in alpine meadows and alpine sandy land. The red circles, lines, and words refer to the trait relationships in the alpine meadows, and the blue pluses, lines, and words refer to the trait relationships in the sand habitats.
Figure 6.
Figure 6.
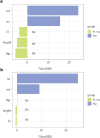
Random forest analysis identified vegetative and flower traits that dominate changes in visitation rates of bumble bees (a) and mason bees (b). * P < 0.05, ** P < 0.01. ‘nvf’ refers to nectar volume per flower, ‘nc’ refers to nectar concentration, ‘fz’ refers to flower size, ‘height’ refers to plant height, and ‘fnp’ refers to flower number per plant. %IncMSE indicates the increase of the Mean Squared Error when a given variable is randomly permuted. The larger the value of IncMSE, the greater the influence of the characteristic variable on the target. Blue bars indicate statistical significance, and green bars indicate statistical insignificance.
Figure 7.
Figure 7.
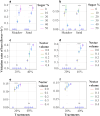
The figures show the visitation rate of bumble bees (a) and mason bees (b) at the nectar concentration (0%–50% sugar) addition treatment, the visitation rate of bumble bees in alpine meadows (c) and in alpine sandy habitats (d), as well as the visitation rate of mason bees in alpine meadows (e) and in alpine sandy habitats (f) at the nectar volume (0–0.4 µl) addition treatment. The blue circle represents the mean of the responses. The line represents the standard error. The star denotes significant differences among treatments (P < 0.05).

References

    1. Aguilar R, Ashworth L, Galetto L et al. Plant reproductive susceptibility to habitat fragmentation: review and synthesis through a meta-analysis. Ecol Lett 2006;9:968–80. 10.1111/j.1461-0248.2006.00927.x - DOI - PubMed
    1. Ahrenfeldt EJ, Sigsgaard L, Hansted L et al. Forage quality and quantity affect red mason bees and honeybees differently in flowers of strawberry varieties. Entomol Exp Appl 2019;167:763–73. 10.1111/eea.12820 - DOI
    1. Aizen MA, Vazquez DP. Flower performance in human-altered habitats. In: Harder LD, Barrett SCH (eds.) Ecology and Evolution of Flowers. Oxford, UK: Oxford University Press, 2006, 159–79.
    1. Allen-Perkins A, Artamendi M, Montoya D et al. Untangling the plant reproductive success of changing community composition and pollinator foraging choices. Ecography 2025;2025:e07240. 10.1111/ecog.07240 - DOI
    1. Arroyo MTK, Armesto JJ, Primack RB. Community studies in pollination ecology in the high temperate Andes of central Chile II. Effect of temperature on visitation rates and pollination possibilities. Pl Syst Evol 1985;149:187–203. 10.1007/BF00983305 - DOI

LinkOut - more resources