. 2025 Oct 2;16(1):8779.
doi: 10.1038/s41467-025-63750-2.

Platelet activation plays a pro-inflammatory role in myasthenia gravis

Affiliations

Platelet activation plays a pro-inflammatory role in myasthenia gravis

Qi Wen et al. Nat Commun. .

Abstract

Myasthenia gravis (MG) is an autoimmune disorder that disrupts neuromuscular junction function through autoantibodies. Platelets are emerging as key players in the pathogenesis of MG, bridging innate and adaptive immunity. We analyze platelet transcriptome signatures and their interactions with the immune system in AChR+ immunotherapy-naïve MG (nMG) patients using bulk and single-cell RNA sequencing on peripheral blood mononuclear cells (PBMC). nMG patients exhibit upregulation of genes related to activation, inflammation, and cytoskeletal regulation. Increased platelet count, activation, altered morphology, enhanced CD62P expression, and elevated plasma CD40L levels are observed in PBMCs, which diminish with minimal clinical status (MMS). Functionally, platelets show heightened interactions with leukocytes, forming aggregates that correlate with disease severity. These features return to baseline after intravenous immunoglobulin or prolonged immunosuppressive therapy. This study underscores platelet activation's critical role in MG and supports platelet-targeted therapy.


Conflict of interest statement

Competing interests: The authors declare no competing interests.

Figures

Fig. 1
Fig. 1. Flow chart of participants screening and enrollment in different study parts.
nMG immunotherapy-naïve myasthenia gravis, HC healthy controls, MMS minimal clinical status, scRNA-seq single-cell RNA sequencing, TEM transmission electron microscopy, NETs neutrophil extracellular traps.
Fig. 2
Fig. 2. PBMCs scRNA-seq revealed elevated platelet count in MG and validated by peripheral blood laboratory test.
a Overview of the scRNA-seq experiment: PBMCs were isolated from three HC and three nMG patients, plus samples from two of the aforementioned MG patients when they achieved MMS post-treatment. b UMAP representation of scRNA-seq data illustrating the 16 cell types, including CD8+ T cells (CD8 CTL), CD4+ effector T cells (CD4 Tm), natural killer cells (NK), naïve B cells (Naïve B), CD8+ effector memory T cells (CD8 Tem), naïve CD8+ T cells (CD8 Naïve), gamma delta T Cells (γδ T), naïve CD4+ T cells (CD4 Naïve), CD14+ monocytes (CD14 MC), memory B Cells (Memory B), platelets, memory CD4+ T cells (Memory CD4 T), conventional dendritic cells (cDCs), plasmacytoid dendritic cells (pDCs), CD16+ monocytes (CD16 MC), and Plasma cells. c Stacked bar plot showing the relative abundance of PBMC subsets across nine samples. Each bar represents the proportion of identified cell clusters. d UMAP visualization illustrating the cluster abundance in PBMCs across three groups. The platelet cluster (encircled) is prominently enlarged in the MG group. e Boxplot analysis of platelet percentage by group, with statistical significance assessed via one-way ANOVA (two-sided, p = 0.12). The boxplot shows the minimum, first quartile, median, third quartile, and maximum values. Dashed lines indicate the comparative percentage of platelets in the same patient pre- and post-treatment. f A heatmap showcases the expression of genes related to platelet degranulation across the sample set. g Across a larger MG patient cohort, peripheral blood tests confirmed that nGMG patients (n = 65) exhibited higher platelet counts compared to HC (n = 25, p = 0.007) and MMS patients (n = 40, p = 0.0001). No significant differences were found between nOMG patients (n = 25) and the other groups. Data are presented as mean ± s.d., with individual biological replicates shown. P values were determined using ordinary one-way ANOVA followed by Tukey’s multiple comparisons test. Significance levels are denoted by asterisks: **p < 0.01; ****p < 0.0001. Non-significant results are not depicted. h The Circos plot presents the predicted cell-cell communication network, specifically mapping platelet-derived signaling to various immune cell populations in the MG (left, red), HC (middle, blue), and MMS (right, orange) groups. i, j Bubble plot visualization of platelet-mediated ligand-receptor interactions in MG. Each bubble represents an interaction between platelets and a specific immune cell type, with bubble color indicating the communication probability. The statistical inference method calculates communication probability by comparing the observed ligand-receptor expression against a null distribution generated through cell-label permutation, and assigns p values accordingly. i depicts incoming signals received by platelets, while j represents outgoing signals from platelets to other immune cells. The y-axis lists specific ligand-receptor pairs involved in these interactions, providing insight into platelet-driven immune modulation. PBMCs peripheral blood mononuclear cells, HC healthy controls, MMS minimal clinical status, nGMG immunotherapy-naïve generalized myasthenia gravis, nOMG immunotherapy-naïve ocular myasthenia gravis, IST immunological suppressive treatment, UMAP Uniform Manifold Approximation and Projection, Commun. Prob communication probability. Source data are provided as a Source data file.
Fig. 3
Fig. 3. Differential gene expression and pathway enrichment analysis in washed platelets from nMG patients and healthy controls using bulk RNA sequencing.
a Volcano plot depicting DEGs in platelets between nMG and HC. Upregulated genes (p ≤ 0.05, FC ≥ 1.2) are marked in red, downregulated genes (p ≤ 0.05, FC ≤ −1.2) are marked in blue, and gray dots represent genes with no significant change. Genes selected for clustering analysis met the following criteria: 1 < max{log₂(FPKM + 1)} < 20. Statistical significance was assessed using a two-sided t-test, and no adjustments were made for multiple comparisons. b GO enrichment analysis of the upregulated DEGs, with significant terms categorized under biological processes, cellular components, and molecular functions. Statistical significance for the enrichment was determined using Fisher’s Exact Test (two-sided) for each GO term, with p values adjusted for multiple comparisons using Benjamini-Hochberg correction. c KEGG pathway enrichment analysis of the top 20 pathways associated with the upregulated DEGs. Pathway enrichment was assessed using Fisher’s Exact Test (two-sided), with p values adjusted for multiple comparisons using Benjamini-Hochberg correction. d GSEA showing enriched pathways in platelets from nMG patients, with color-coded curves indicating significance (red: high enrichment, purple: low enrichment). e Classification of TFs based on comparison with the HumanTFDB databases. FC fold change, GO Gene Ontology, KEGG Kyoto Encyclopedia of Genes and Genomes, FPKM fragments per kilobase of exon model per million mapped fragments, TF transcription factor, DEGs differentially expressed genes, nMG immunotherapy-naïve MG, HC healthy controls, MMS minimal clinical status.
Fig. 4
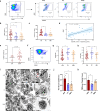
Fig. 4. Activation and functional characterization of platelets in nMG patients.
a Gating strategy for activated platelets and representative flow cytometry scatter plots of CD62P+ platelet populations in nMG, HC, and MMS participants. The left panel shows the initial gating of CD61+ events, followed by further analysis of CD62P expression (right panels). b The percentage of CD61+CD62P+ platelets is higher in the nMG (n = 50) group compared to HC (n = 20, p = 0.0307) and MMS (n = 35, p = 0.0037) groups. c A significant increase of sCD40L levels was observed in the nMG (n = 24) group compared to the HC group (n = 18, p = 0.0264). No significant difference was found between nMG and MMS (n = 18). d Positive association were observed between plasma sCD40L levels and QMG score (n = 24, R = 0.57, p = 0.0034). e Influence of APT on the frequency of CD62P+ platelet in nMG patients, with no significant difference observed (n = 9 for APT and n = 41 for N-APT; p = 0.216). f Representative flow cytometry scatter plot illustrating the gating strategy for free platelets. The CD45CD61⁺ population was identified as free platelets, and the FSC/SSC parameters for this specific population were automatically calculated using FlowJo software. g, h Comparative analysis of FSC and SSC profiles of platelets from nMG (n = 50), HC (n = 20), and MMS (n = 35) participants, showing significant differences in platelet size and internal complexity (FSC: nMG vs HC, p = 0.0124; SSC: nMG vs HC, p = 0.0032, nMG vs MMS, p = 0.0109). i Representative transmission electron microscopy images showing platelet morphology in nMG, HC, and MMS groups. Red arrows indicate platelet microparticles. Scale bars: 2 μm in the left column and 1 μm in the middle and right columns. j For each patient, we randomly selected five microscopic fields and counted the number of non-spheroid platelets (platelets exhibiting signs of activation, such as filopodia or lamellipodia, deviating from the typical discoid shape) and total platelets within each field. The percentage of non-spheroid platelets was determined by calculating the ratio of non-spheroid platelets to total platelets for each field, followed by averaging the ratios across the five fields. The percentage of non-spheroid platelets was increased in nMG patients (n = 4) compared to both HC (n = 4, p = 0.0266) and MMS (n = 4, p = 0.0295) groups. k The PMP count per platelet was obtained by calculating the PMPs/total platelet ratio for each field and averaging these values across the five fields. The PMPs per platelet count were also increased in the nMG group (n = 4) compared with HC (n = 4, p = 0.0466). For (b, c, e, g, h, j, k), data are presented as mean ± s.d., with individual biological replicates shown. Statistical significance was assessed using ordinary one-way ANOVA (two-sided), followed by Tukey’s multiple comparisons test, except for (e), where an unpaired two-tailed Student’s t-test was used. For correlation analysis in (d), two-sided Spearman’s rank correlation was applied, and the regression line is shown with a shaded area indicating the 95% confidence interval. Significance levels are denoted by asterisks: *p < 0.05; **p < 0.01. Non-significant results are not depicted. nMG immunotherapy-naïve MG, HC healthy controls, MMS minimal clinical status, ADL activity of daily living, QMG score quantitative myasthenia gravis scores, FSC forward scatter, SSC side scatter, APT antiplatelet therapy, Conc. concentration, PMPs platelet-derived microparticles. Source data are provided as a Source data file.
Fig. 5
Fig. 5. Platelet-leukocyte interaction increased in MG.
a A representative flow cytometry scatter plot delineates the identification of PLAs within the CD61+ CD45+ population. b The dot plot comparison of the percentage of PLAs reveals a statistically significant increase in PLAs among MG patients (n = 50) compared to the HC (n = 20, p = 0.0034) and MMS group (n = 35, p = 0.0002). c A pronounced upsurge in circulating PNAs is observed in MG patients (n = 50) compared to HC (n = 20, p = 0.0002) and MMS group (n = 35, p = 0.0002), with no significant changes detected in the aggregates involving monocytes and lymphocytes with platelets (d, e). f Positive correlation was observed between the percentage of PNAs and QMG score (n = 50, R = 0.46, p = 0.00084). g Significant reduction in PNAs in MG patients following treatment with long-term IST or short-term IVIg therapy (n = 6, p = 0.0032). h Schematic representation of experimental platelet-neutrophil co-culture design. Top row: Platelets were co-cultured with neutrophils from nMG, HC, or MMS patients, or with neutrophil-derived NETs from nMG patients to assess platelets activation. Middle row: Neutrophils from nMG, HC, or MMS patients were cultured overnight to assess NETs formation. Bottom row: Neutrophils were co-cultured with platelets from nMG, HC, or MMS patients to assess NETs formation. i Quantification of platelet activation levels (normalized CD62P MFI) after co-culture with neutrophils or NETs from nMG, HC, or MMS patients (n = 7 per group). Platelets co-cultured with nMG-derived neutrophils or NETs displayed significantly higher activation levels than those co-cultured with neutrophils from HC or MMS groups (n = 7 per group; Plt+nMG_Neu vs. Plt+HC_Neu, p = 0.0009, Plt+nMG_Neu vs. Plt+MMS_Neu, p < 0.0001, Plt+HC_Neu vs. Plt+NETs, p = 0.0258, Plt+MMS_Neu vs. Plt+NETs, p = 0.0002). j MPO-DNA complex levels in the supernatant following overnight culture of neutrophils from nMG, HC, and MMS patients (n = 7 per group). Neutrophils from nMG patients released significantly higher levels of NETs compared to HC or MMS groups (nMG vs. HC, p = 0.0016; nMG vs. MMS, p = 0.0005). k MPO-DNA complex levels in plasma samples from MG (n = 25), HC (n = 25), and MMS patients (n = 10). Plasma from MG patients contained significantly elevated NETs levels compared to HC plasma (p = 0.0016). l MPO-DNA complex levels in the supernatant following neutrophil co-culture with platelets from nMG, HC, and MMS groups (n = 7 per group). Platelets from nMG patients significantly promoted NETs release from neutrophils compared to platelets from the HC group (p < 0.0001). For (be, g, i, jl), data are presented as mean ± s.d. with individual biological replicates. For correlation analysis in (f), two-sided Spearman’s rank correlation was used, and regression lines are shown with shaded 95% confidence intervals. Statistical significance was assessed by ordinary one-way ANOVA with Tukey’s multiple comparisons test (be, i, jl) or paired two-tailed Student’s t-test. Significance levels are denoted by asterisks: *p < 0.05; **p < 0.01; ***p < 0.001; ****p < 0.0001. Non-significant results are not depicted. nMG immunotherapy-naïve MG, HC healthy controls, MMS minimal clinical status, PLAs platelet-leukocyte aggregates, PNAs platelet-neutrophil aggregates, PLyAs platelet-lymphocyte aggregates, PMAs platelet-monocyte aggregates, QMG score quantitative myasthenia gravis scores, IST immunosuppressive therapy, IVIg intravenous immunoglobulin, NETs neutrophil extracellular traps, MFI mean fluorescence intensity. Source data are provided as a Source data file.
Fig. 6
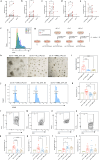
Fig. 6. Platelet influence on T Cell proliferation and differentiation.
To compare the proliferation and differentiation of CD4+ T cells, stimulation with PMA (50 ng/mL) and ionomycin (1 μg/mL) in the presence of BD GolgiStop™ protein transport inhibitor was performed for 6 h prior to harvesting CD4+ T cells on the fourth day of co-culture. Platelet supernatants, compared to direct co-culture (n = 18 per group), significantly amplified the proliferation (a) and effector differentiation (be) of Tn cells. A notable increase in the frequencies of proliferated (a, p = 0.049), IFNγ+ (b, p = 0.0388), TNFα+ (c, p = 0.0087), and IL17A+ (d, p = 0.0068) CD4+ T cells was observed, indicating enhanced inflammatory potential. No significant differences were observed in the frequencies of Foxp3+ CD4+ T cells (e). The dashed line represents a baseline value normalized to act.Tn data (normalized to 1). f In a separation-based co-culture assay, a platelet-to-Tn cell ratio of 1:100 significantly potentiated the proliferative response of Tn cells, as demonstrated by the dilution of CFSE intensity. g We selected the 1:100 cell ratio and employed a non-contact co-culture method for subsequent experiments to compare the impact of overnight-cultured platelet supernatants, derived from MG, HC, and MMS patients, on the proliferation and differentiation of Tn cells. Experimental groups include Tn cells without anti-CD3/CD28 magnetic bead activation; Tn cells cultured alone following activation with anti-CD3/CD28 beads; and activated Tn cells co-cultured with supernatants from washed platelets derived from MG, HC, and MMS patients, at a cell-to-supernatant ratio of 1:100. h Representative Microscopy images show that Tn cells co-cultured with washed platelet supernatants from nMG patients (act.Tn + nMG_w.Ps, D3) formed more and larger cell aggregates compared to those co-cultured with HC (act.Tn + HC_w.Ps, D3) and MMS (act.Tn + MMS_w.Ps, D3) supernatants. Scale bar = 200 µm. The statistical analysis of aggregate diameter, measured using ImageJ, is shown in (i; n = 14 for nMG group, n = 18 for HC group, n = 16 for MMS group; nMG vs. HC, p < 0.0001; nMG vs. MMS, p < 0.0001). j Corresponding flow cytometry analysis of CFSE fluorescence decay indicates a significant enhancement in CD4+ T cell proliferation in the presence of nMG platelet supernatants. k The CFSE subset percentages are shown for each condition, demonstrating the highest proliferation in the nMG group (n = 17 for each group, nMG vs. HC, p = 0.0008; nMG vs. MMS, p = 0.0105). Flow cytometry gating strategies for identifying IFNγ+ (l), TNFα+ (m), Foxp3+ (n), and IL17A+ (o) subsets within the live CD3+ T cell population. Comparative analyses of normalized percentages across groups (n = 10 per group) show the relative abundance of IFNγ+ (p) (nMG vs. HC, p < 0.0001; nMG vs. MMS, p < 0.0001), TNFα+ (q) (nMG vs. HC, p = 0.0412; nMG vs. MMS, p = 0.0431), Foxp3+ (r) (nMG vs. HC, p = 0.0045; nMG vs. MMS, p = 0.0021), and IL17A+ (s) CD4+ T cells upon co-culture with platelet supernatants from various sources. For (i, k, ps), data are presented as mean ± s.d. with individual biological replicates. Statistical significance was assessed by paired two-tailed Student’s t-test (ae) or ordinary one-way ANOVA with Tukey’s multiple comparisons test (i, k, ps). Notions of statistical significance are as follows: *p < 0.05; **p < 0.01; ***p < 0.001; ****p < 0.0001; Non-significant results are not depicted. nMG immunotherapy-naïve MG, HC healthy controls, MMS minimal clinical status, Pro. proliferation, Tn cells naïve CD4+ T cells, act.Tn activated naïve CD4+ T, w.P washed platelets, w.Ps washed platelet supernatant. Source data are provided as a Source data file.
Fig. 7
Fig. 7. Effects of cytokine neutralization on T cell proliferation and differentiation.
a Experimental group setup for the platelet cytokine neutralizing antibody experiment. Groups include Tn cells without anti-CD3/CD28 magnetic bead activation; Tn cells cultured alone post-activation with anti-CD3/CD28 beads; activated Tn cells co-cultured with supernatants from washed platelets derived from MG or HC sources, pre-treated with anti-RANTES/PF4/TGFβ1 antibodies, at a cell-to-supernatant ratio of 1:100. b Microscopy images reveal less pronounced T cell clustering in conditions where RANTES is neutralized, compared to non-neutralized environments (Column 1). Scale bar: 100 μm. Corresponding flow cytometry profiles demonstrate increased CFSE dilution, indicating suppressed proliferation (Column 2). RANTES neutralization leads to a decrease in IFNγ+ and TNFα+ T cell populations, indicating inhibition of Th1 polarization (Columns 3–4). c Quantitative analysis shows that neutralization of TGFβ1 and PF4 in HC-derived platelets enhances Tn cell proliferation (n = 10 per group) (IFNγ+ T cell populations: act.Tn+MG_w.Ps vs. act.Tn+MG_w.Ps+RANTES n.Ab, p < 0.0001; TNFα+ T cell populations: act.Tn+HC_w.Ps vs. act.Tn+HC_w.Ps+RANTES n.Ab, p = 0.0278; act.Tn+HC_w.Ps vs. act.Tn+HC_w.Ps+PF4 n.Ab, p = 0.0067; act.Tn+HC_w.Ps vs. act.Tn+HC_w.Ps+ TGFβ1 n.Ab, p = 0.022). d, e The impact of neutralizing antibodies on the frequency of IFNγ+ and TNFα+ T cells is shown (n = 10 per group), indicating that neutralization of RANTES suppresses Th1 responses (act.Tn+MG_w.Ps vs. act.Tn+MG_w.Ps+RANTES n.Ab, p = 0.0064; act.Tn+MG_w.Ps vs. act.Tn+MG_w.Ps+RANTES n.Ab, p = 0.038), while TGFβ1 and PF4 neutralization do not significantly affect Th1 response in either MG patient-derived or control groups. f, g The frequency of IL17A+ and Foxp3+ Treg cells within Tn cell cultures is depicted, demonstrating the effects of different neutralizing antibodies. For (cg), data are presented as mean ± s.d. with individual biological replicates, and statistical significance was assessed by ordinary one-way ANOVA with Tukey’s multiple comparisons test. Notions of statistical significance are as follows: *p < 0.05; **p < 0.01; ****p < 0.0001. nMG immunotherapy-naïve MG, HC healthy controls, MMS minimal clinical status, Pro. proliferation, Tn naïve CD4+ T, act.Tn activated naïve CD4+ T, w.Ps washed platelet supernatant, n.Ab neutralization antibody. Source data are provided as a Source data file.
Fig. 8
Fig. 8. RANTES and sCD40L levels in platelet supernatants and co-cultures.
a RANTES levels were notably elevated in MG (n = 16) patient-derived platelet culture supernatants compared to HC and MMS groups (n = 10 per group; MG vs MMS p = 0.0481; MG vs MMS p = 0.0476). b Co-culture supernatants show elevated RANTES levels in MG patient-derived platelets co-cultured with Tn compared to HC-derived platelets (n = 7 per group, p = 0.0055). c RANTES levels in plasma were elevated in MG patients (n = 24), with a significant increase observed compared to the MMS group (n = 18; p = 0.0187). No significant differences were detected between MG and HC or between HC and MMS (n = 18 for HC). Positive correlations were observed between QMG scores and RANTES concentrations in plasma (d, n = 24) and platelet supernatants (e, n = 16). Correlations were assessed using Spearman’s rank correlation (R = 0.5, p = 0.013 for plasma; R = 0.63, p = 0.0095 for platelet supernatants). f sCD40L levels in MG (n = 16) patient-derived platelet supernatants were significantly higher compared to the HC group (n = 10, p = 0.0264). g Co-culture supernatants also exhibit increased sCD40L levels in MG patient-derived platelets co-cultured with Tn cells compared to HC-derived platelets (n = 7 per group; p = 0.0159). A significant positive correlation was observed between plasma levels of sCD40L and RANTES (h, n = 24), suggesting a potential regulatory relationship. Correlation was assessed using Spearman’s rank correlation (R = 0.47, p = 0.021). i RANTES neutralization in CD3/CD28-stimulated platelet-CD4+ T cell co-cultures (n = 11) led to a significant reduction in sCD40L levels (p = 0.0033), indicating that RANTES influences sCD40L secretion. For (ac, f, g), data are presented as mean ± standard deviation (s.d.) with biologically independent data points shown. For (i), data are displayed as individual biological replicates with paired analysis. Statistical comparisons were performed using unpaired two-tailed Student’s t-tests (a, g), one-tailed Mann–Whitney U test (b), ordinary one-way ANOVA followed by Tukey’s multiple comparisons test (c, f), and paired two-tailed Student’s t-test (i). In all correlation plots (d, e, h), regression lines are shown with shaded 95% confidence intervals. Notions of statistical significance are as follows: *p < 0.05; **p < 0.01. Non-significant results are not depicted. nMG immunotherapy-naïve MG, HC healthy controls, MMS minimal clinical status, QMG score quantitative myasthenia gravis scores, w.Ps washed platelet supernatant, Tn naïve CD4+ T, Conc. concentration, n.Ab neutralization antibody. Source data are provided as a Source data file.

References

    1. Huijbers, M. G., Marx, A., Plomp, J. J., Le Panse, R. & Phillips, W. D. Advances in the understanding of disease mechanisms of autoimmune neuromuscular junction disorders. Lancet Neurol.21, 163–175 (2022). - PubMed
    1. Uzawa, A. et al. Roles of cytokines and T cells in the pathogenesis of myasthenia gravis. Clin. Exp. Immunol.203, 366–374 (2021). - PMC - PubMed
    1. Villegas, J. A., Van Wassenhove, J., Le Panse, R., Berrih-Aknin, S. & Dragin, N. An imbalance between regulatory T cells and T helper 17 cells in acetylcholine receptor-positive myasthenia gravis patients. Ann. N. Y. Acad. Sci.1413, 154–162 (2018). - PubMed
    1. Zhao, R., Luo, S. & Zhao, C. The role of innate immunity in myasthenia gravis. Autoimmun. Rev.20, 102800 (2021). - PubMed
    1. Payet, C. A. et al. Myasthenia gravis: an acquired interferonopathy? Cells11, 1218 (2022). - PMC - PubMed

MeSH terms

LinkOut - more resources