. 2025 Oct 2;15(1):34331.
doi: 10.1038/s41598-025-16704-z.

Cancer cell dynamics on silica fibers

Affiliations

Cancer cell dynamics on silica fibers

Toru Miyake et al. Sci Rep. .

Abstract

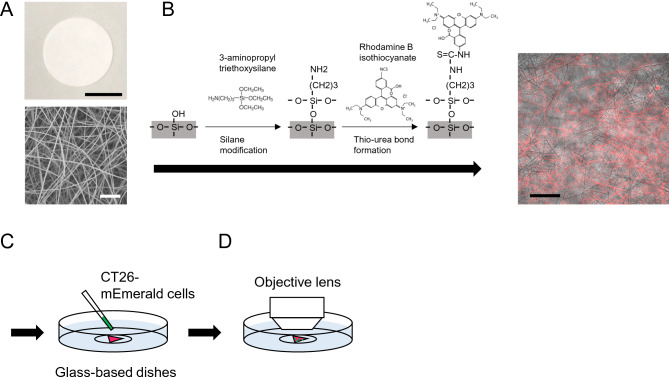
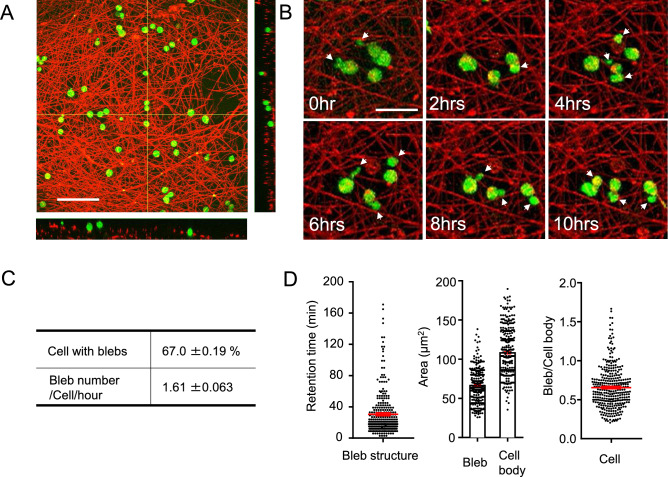
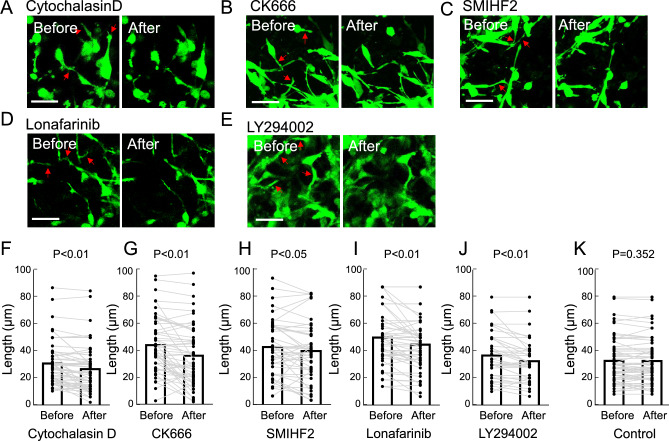
Cancer cells exhibit diverse morphological adaptations in response to the varying environments encountered during cancer progression. However, few experimental platforms enable consistent and comprehensive observation of these dynamic behaviors, particularly during the early phases of cancer cell dissemination through the rigid collagen-rich dermis. In this study, we employed a three-dimensional (3D) nonwoven silica fiber scaffold to investigate how a 3D microenvironment influences cellular membrane dynamics. When fluorescent CT26 cancer cells were seeded onto the silica fiber scaffold, we discovered the cells attached loosely to the fibers displayed stable bleb structures. After initial loose attachment, the cells transitioned to a more anchored state, extending stable, elongated membrane protrusions that were not observed in conventional 2D cultures. Detailed examination of these protrusions further revealed the formation of smaller, perpendicular extensions along the length of the membrane protrusions. The maintenance of elongated membrane structures was regulated by actin dynamics mediated through signaling pathways, including MAP kinase and PI3 kinase. In the spheroid system that mimics primary tumors, Cellbed served as a substrate that accepts detached cancer cells from the spheroids, simulating loose connective tissue containing collagen fibers adjacent to primary tumors. Thus, we found various cancer cell behaviors using the silica fiber scaffold that provides as a valuable platform for reproducibly and comprehensively studying cancer cell dynamics in 3D environments, offering new insights into cell behavior beyond the constraints of 2D culture systems.

Keywords: Cancer; Connective tissues; Fluorescent microscopy; Metastasis; Silica fiber.


Conflict of interest statement

Declarations. Competing interests: The authors declare no competing interests.

Figures

Fig. 1
Fig. 1
Schematic representation of the procedure for observing cancer cell membrane dynamics on Cellbed. (A) Overview (top) and magnified (bottom) images of Cellbed. The black and white scale bars represent 10 mm and 20 μm, respectively. (B) Silanization process of Cellbed. Rhodamine B-conjugated Cellbed image was shown on the right. The black scale bar represents 100 μm. (C) CT26-mEmerald cells were seeded onto Cellbed placed in glass-bottom dishes. (D) Dynamics of CT26-mEmerald cells on Cellbed were observed using time-lapse imaging with a laser scanning upright microscope.
Fig. 2
Fig. 2
Stable bleb structures immediately after seeding on Cellbed. (A) Representative 3D image captured immediately after CT26-mEmerald cells were seeded onto Cellbed. The white scale bar represents 100 μm. (B) Time-lapse images of CT26-mEmerald cells exhibiting stable bleb structures. The white scale bar represents 50 μm. (C) Quantification of the percentage of cells exhibiting stable bleb structures and the frequency of their occurrence (number per cell per hour). (D) Analysis of bleb retention time, bleb size, and the ratio of bleb size to cell body size in CT26-mEmerald cells.
Fig. 3
Fig. 3
CT26-mEmerald cells exhibited elongation along the fibers. (A) Representative image of CT26-mEmerald cells with membrane protrusions on Cellbed. Protrusions are indicated by white arrows. (B) Nuclear morphology of CT26-mEmerald cells on Cellbed. (C) Overview of cancer cells on Cellbed captured by scanning electron microscopy. (D) CT26-mEmerald cells cultured on standard flat culture plates. (E) Nuclear morphology of CT26-mEmerald cells on a flat culture plate. The white scale bars in all images represent 20 μm. (F) Quantification of cancer cell morphology: a total of 50 2D cells from 5 images and 74 3D cells from 5 images were analyzed. Data are presented as mean ± S.D. “Major” and “Minor” indicate the lengths of the major and minor axes of an ellipse fitted to the object boundary, respectively. “Max Feret” refers to the maximum Feret diameter.
Fig. 4
Fig. 4
Dynamics of protrusion structures on Cellbed. (A) Overview of CT26-mEmerald cells on Cellbed. (B, C) Visualization of ruffle extension (B) and protrusion retraction (C). (D, E) Branching protrusions extending perpendicularly from a membrane protrusion captured by fluorescence microscopy (D) and scanning electron microscopy (E). (F) Image of a cancer cell engulfing a fiber (indicated by black arrows). (G) Fluorescence images showing a cancer cell engulfing a fiber (indicated by white arrowheads). Three images were taken at 2 μm intervals in the depth direction. The white bars in Fig. 4 represent 20 μm.
Fig. 5
Fig. 5
Effects of inhibitors on membrane protrusion length. Analysis of changes in membrane protrusion length before and after the addition of 2 μM cytochalasin D (A, F), 30 μM CK666 (B, G), 30 μM SMIHF2 (C, H), 10 nM lonafarnib (D, I), 1 μM LY294002 (E, J) or 0.1% DMSO in HBSS solution as a control (K). The white scale bar represents 50 μm.
Fig. 6
Fig. 6
the system to evaluate metastatic malignancy using spheroids on Cellbed. (A) Schematic of the procedure to observe spheroids on Cellbed. (B) Representative images of spheroids consisting of 300 CT26-mEmerald cells on Cellbed (upper panel) and CT26-mEmerald cells that migrated to Cellbed 17 h after seeding (lower panel). The white bar represents 100 μm. (C) Representative images of spheroids on collagen-coated dishes immediately after seeding (upper panel) and dispersed CT26-mEmerald cells from a fused spheroid adhered to the dish surface (lower panel). The white bar represents 100 μm. (D) Analysis of the number of CT26-mEmerald cells that migrated from spheroids to Cellbed.

References

    1. Graziani, V. et al. The amoeboid state as part of the epithelial-to-mesenchymal transition programme. Trends Cell Biol.32(3), 228–242 (2022). - PubMed
    1. Murphy, D. A. & Courtneidge, S. A. The ‘ins’ and ‘outs’ of podosomes and invadopodia: Characteristics, formation and function. Nat. Rev. Mol. Cell. Biol.12(7), 413–426 (2011). - PMC - PubMed
    1. Eddy, R. J. et al. Tumor cell invadopodia: Invasive protrusions that orchestrate metastasis. Trends Cell Biol.27(8), 595–607 (2017). - PMC - PubMed
    1. Kienast, Y. et al. Real-time imaging reveals the single steps of brain metastasis formation. Nat. Med.16(1), 116–122 (2010). - PubMed
    1. Nazari, S. S. et al. Long prehensile protrusions can facilitate cancer cell invasion through the basement membrane. Cells12(20), 2474 (2023). - PMC - PubMed

LinkOut - more resources