. 2025 Oct 2;15(1):34352.
doi: 10.1038/s41598-025-16889-3.

Preclinical models of melanoma leptomeningeal disease to assess intrathecal checkpoint blockade

Affiliations

Preclinical models of melanoma leptomeningeal disease to assess intrathecal checkpoint blockade

Renato A Guerrieri et al. Sci Rep. .

Abstract

Leptomeningeal disease (LMD) is a subtype of central nervous system metastatic disease that is associated with poor patient outcomes and limited treatment options. There is an unmet need to develop preclinical models of LMD to expedite and improve the development of new therapeutics. Here, we describe the development of multiple orthotopic immunocompetent murine models of melanoma LMD, including their use to assess the efficacy of systemic and/or intrathecal immunotherapy. LMD was established by direct intrathecal injection of murine cell lines (B16-F10, BP, D4M, D4M-UV2, MC38-gp100, RMS, YUMM3.1, and YUMMER1.7) into the cisterna magna of C57BL/6 mice. Tumor take rate, distribution, histology, peri-procedural mortality, and animal survival were assessed for each cell line. Intrathecal and systemic treatment with anti-PD1 were tested for safety, efficacy, and immune infiltration for LMD. Cisternal injection of murine melanoma cell lines successfully established LMD with low peri-procedural mortality, high tumor take rate, and varied survival duration across the panel of cell lines. Decreasing the total number of cells injected and increasing the volume of suspension of the injected cells increased the rate of distal spinal cord deposits, reflecting the common clinical distribution of LMD. Intrathecal administration of anti-PD1 in non-tumor bearing mice caused no morbidity or toxicity. Concurrent intrathecal and systemic anti-PD1 immunotherapy increased the survival of mice with murine melanoma LMD. We have established and characterized several immunocompetent murine models of LMD to facilitate the development and testing of new, more effective immunotherapy strategies for melanoma patients with LMD.

Keywords: Immunotherapy; Intrathecal; Leptomeningeal disease; Melanoma; anti-PD1.


Conflict of interest statement

Declarations. Competing interests: The authors declare no competing interests. Consent for publication: All authors agree with publication. Ethics approval: The Institutional Animal Care and Use Committee at MD Anderson Cancer Center approved all procedures involving mice in this study (Davies Protocol 00000743-RN02).

Figures

Fig. 1
Fig. 1
IT injection of B16-F10 melanoma (1.5 × 10^4 in 10 µL suspension) produces LMD in C57BL/6 mice. (A) Bioluminescence imaging (BLI) of C57BL/6 mice injected with 1.5 × 10^4 (15 K) luciferase-tagged B16-F10. All mice had positive signal at day 3 post-IT injection. (B) Line graph showing BLI flux signal post-injection of 15 K luciferase-tagged B16-F10. (C) Gross photographs of C57BL/6 mice after IT injection of 15 K B16-F10 in 10 µL suspension. Red arrows indicate spinal cord (top) and cranial melanoma deposits; yellow arrow indicates tumor deposit at site of IT injection. (D) Representative H&E slides at 4X magnification from C57BL/6 mice after IT injection of 15 K B16-F10 in 10 µL suspension. Asterisks (*) denote LMD deposits in the spinal cord (lower left) and brain cortex (all others). (E) Representative slides with IHC stain for melanoma marker MART1 at 4X magnification from C57BL/6 mice after IT injection of 15 K B16-F10 in 10 µL suspension. Asterisks (*) denote MART1 positive LMD deposits. Far left: cranial cortex; center: intraventricular; far right: spinal cord.
Fig. 2
Fig. 2
IT injection (15 K in 10 µL suspension) of syngeneic melanoma cell lines produce LMD in C57BL/6 mice. (A) Bar chart showing peri-procedural mortality following IT injection of 15 K in 10 µL suspension of melanoma cell lines and MC-38 (colon cancer cell line). N = 5 for B16-F10, BP, D4M, D4M-UV2, RMS, YUMMER1.7; N = 9 for YUMM3.1; N = 4 for MC38-gp100. X-axis indicates cell line. Y-axis indicates percentage of mice dying following IT injection of 15 K cells in 10 µL suspension. (B) Bar chart showing BLI positivity following IT injection of 15 K melanoma cell lines in C57BL/6 mice. X-axis indicates cell line. Y-axis indicates percentage of mice with BLI positive signal at day 3 post IT injection. (C) Survival curves following IT injection of 15 K in 10 µL suspension of melanoma cell lines. (D) Bar chart showing the percentage of spinal cord deposits in post-mortem C57BL/6 mice following IT injection of 15 K in 10 µL suspension of pigmented cell lines, B16-F10, BP and RMS.
Fig. 3
Fig. 3
Development of optimized LMD model with IT injection (2 K in 20 µL suspension) of B16-F10 melanoma. (A) BLI of C57BL/6 mice injected with 2.0 × 10^3 (2 K) luciferase-tagged B16-F10 in 20 µL suspension. All mice had positive signal at day 3 post-IT injection. (B) Graph showing BLI flux signal per day post injection of 2 K luciferase-tagged B16-F10. (C) Gross photographs of C57BL/6 mice after IT injection of 2k B16-F10 in 20 µL suspension. Arrows show black spinal (top) and cranial melanoma deposits. (D) Representative H&E slides at 4X magnification from C57BL/6 mice after IT injection of 2k B16-F10 in 20 µL suspension. Asterisks (*) denote LMD deposits. Upper panels cranial cortex deposits; lower panels spinal cord. (E) Representative slides with IHC stain for melanoma marker MART1 at 4X magnification from C57BL/6 mice after IT injection of 2k B16-F10 in 20 µL suspension. Asterisks (*) denote MART1 positive LMD deposits. Far left: cranial cortex; center: intraventricular; far right: spinal cord.
Fig. 4
Fig. 4
Optimized LMD model with IT injection (2 K in 20 µL suspension) of syngeneic melanoma cell lines. (A) Bar chart showing peri-procedural mortality following IT injection of 2k in 20 µL suspension of melanoma cell lines and colon cancer line MC-38. N = 9 for B16-F10, D4M; N = 10 for BP, MC38-gp100, RMS, YUMM3.1; N = 8 for D4M-UV2. X-axis indicates cell line. Y-axis indicates percentage of mice dying following IT injection. (B) Bar chart showing BLI positivity following IT injection of 2 K melanoma cell lines in of C57BL/6 mice. (C) Survival curve for following IT injection of 2 K in 20 µL suspension of melanoma cell lines and MC-38. (D) Bar chart showing the percentage of spinal cord deposits in post-mortem C57BL/6 mice following IT injection of 2 K in 20 µL suspension of B16-F10, BP and RMS cell lines. (E) Bar graph comparing spinal cord distribution in the 15 K in 10 µL suspension versus 2 K in 20 µL suspension. Significantly higher spinal cord distribution was observed in the optimized diluted model in the B16-F10 and BP models. ***p < 0.001, *p < 0.05 by two-sided Student’s t-test.
Fig. 5
Fig. 5
Evaluation of IT anti-PD1 treatment of melanoma LMD in initial preclinical model. (A) Kaplan-Meier OS analysis from treatment initiation of mice that received (1) IT isotype control + systemic isotype control; (2) IT isotype control + systemic anti-PD1; (3) IT anti-PD1 + systemic isotype control; (4) IT anti-PD1 + systemic anti-PD1. Hazard ratio was determined via the Mantel-Haenszel test and significance log-rank test. (B) Comparison of CD8 IHC staining results between samples acquired from mice that received (1) IT isotype control l + systemic isotype control; (2) IT isotype control + systemic anti-PD1; (3) IT anti-PD1 + systemic isotype control; (4) IT anti-PD1 + systemic anti-PD1. Lines represent mean ± S.D., and each dot represents a single sample. **p < 0.01, *p < 0.05 by two-sided Student’s t-test. Treatment study was performed in duplicate.
Fig. 6
Fig. 6
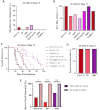
Evaluation of IT anti-PD1 treatment of melanoma LMD in optimized diluted preclinical model. (A) B16 (2 K in 20 µL suspension condition) Kaplan-Meier analysis of (OS) from treatment initiation of mice that received: (1) IT isotype control + systemic isotype control; (2) IT isotype control + systemic anti-PD1; (3) IT anti-PD1 + systemic isotype control; (4) IT anti-PD1 + systemic anti-PD1. (B) Comparison of CD8 IHC staining results between samples acquired from mice that received (1) IT isotype control l + systemic isotype control; (2) IT isotype control + systemic anti-PD1; (3) IT anti-PD1 + systemic isotype control; (4) IT anti-PD1 + systemic anti-PD1. Lines represent mean ± S.D., and each dot represents a single sample. **P < 0.01, *P < 0.05 by two-sided Student’s t-test. (C) YUM3.1 (2 K in 20ul suspension condition) Kaplan-Meier analysis from treatment initiation of mice that received treatments described in (A). (D) Comparison of CD8 IHC staining results between samples acquired from mice that received treatments described in (B). Treatment studies were performed in duplicate.

References

    1. Smalley, K. S. et al. Managing leptomeningeal melanoma metastases in the era of immune and targeted therapy. Int. J. Cancer. 139 (6), 1195–1201 (2016). - PMC - PubMed
    1. Cohen, J. V. et al. Melanoma central nervous system metastases: current approaches, challenges, and opportunities. Pigment Cell. Melanoma Res.29 (6), 627–642 (2016). - PMC - PubMed
    1. Leal, T. et al. Leptomeningeal metastasis: challenges in diagnosis and treatment. Curr. Cancer Ther. Rev.7 (4), 319–327 (2011). - PMC - PubMed
    1. Le Rhun, E., Taillibert, S. & Chamberlain, M. C. Carcinomatous meningitis: leptomeningeal metastases in solid tumors. Surg. Neurol. Int.4 (Suppl 4), S265–S288 (2013). - PMC - PubMed
    1. Garcia Molina, E. & Penas-Prado, M. Neoplastic meningitis in solid tumours: updated review of diagnosis, prognosis, therapeutic management, and future directions. Neurologia (Engl Ed). 37 (9), 794–805 (2022). - PubMed

MeSH terms

Substances