. 2025 Oct 2;8(1):1414.
doi: 10.1038/s42003-025-08818-x.

ABCC4 impairs the clearance of plasma LDL cholesterol through suppressing LDLR expression in the liver

Affiliations

ABCC4 impairs the clearance of plasma LDL cholesterol through suppressing LDLR expression in the liver

Jiaxin Chen et al. Commun Biol. .

Abstract

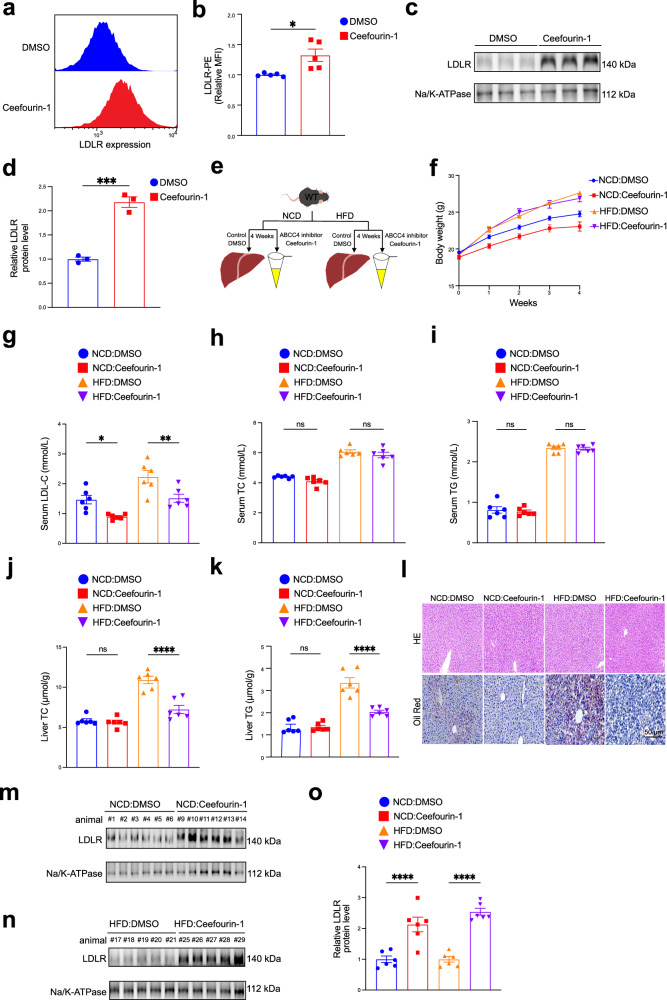
Low expression level of low-density lipoprotein receptor (LDLR) in hepatocytes leads to hypercholesterolemia and eventually contributes to atherosclerotic cardiovascular disease (ASCVD). Here, we report that inhibition of hepatocyte ABCC4, identified as a top hit from large-scale CRISPR/Cas9 screens, significantly increases hepatic LDLR abundance and enhances LDL cholesterol clearance. As a hepatic transporter for cAMP efflux, ABCC4 silencing alters its intracellular distribution and activates the downstream Epac2/Rap1a signaling pathway, which ultimately blocks PCSK9 protein expression, thereby preventing lysosomal degradation of LDLR. Furthermore, in both male mice and cell models, we demonstrate that liver-specific disruption and pharmacological inhibition of ABCC4 elevate hepatic plasma membrane LDLR levels and reduce plasma LDL cholesterol through ABCC4-cAMP-PCSK9 pathway. Collectively, our genome-wide CRISPR screening offers a valuable resource for identifying LDLR modifiers, providing potential insights for therapeutic strategies in hypercholesterolemia and atherosclerosis.


Conflict of interest statement

Competing interests: The authors declare no competing interests.

Figures

Fig. 1
Fig. 1. CRISPR screen identifies ABCC4 as a negative regulator of hepatic LDL receptor.
a Schematic workflow of genome-scale CRISPR screening process. b, c MAGeCK gene enrichment scores comparing LDLRhigh subpopulation and unsorted cells from two independent screens (M1 and M2). d Venn diagram showing genes identified in two independent biological replicates (M1 and M2).
Fig. 2
Fig. 2. ABCC4 depletion increases the cell surface LDLR level independent of its gene expression.
a, b CRISPR/Cas9–mediated knockout of Abcc4 in AML12 cells (a) and LO2 cells (b) using two independent sgRNAs. Immunoblotting analysis of ABCC4 protein expression and Vinculin in control-KO cells and Abcc4-KO cells (Rosa26 sgRNA, Abcc4 sgRNA #1, Abcc4 sgRNA #2). b Immunoblotting experiments of ABCC4 and Vinculin in control-KO cells and ABCC4-KO cells (AAVS1 sgRNA, ABCC4 sgRNA #1, #2). c Flow cytometry data showing that knockout of Abcc4 increased the abundance of LDLR on the AML12 cell surface (Representative data from n = 3 independent experiments with similar results). d Plot showing the relative Mean Fluorescence Intensity (MFI) of PE-LDLR from three independent experiments. e Immunoblotting analysis of plasma membrane fractions demonstrating that Abcc4 knockout dramatically increased the amount of LDLR on PM. f Quantification of band intensity of LDLR protein expression relative to Na/K-ATPase from three independent experiments. g Cultured AML12 cells were precooled to 4°C for 30 min and incubated with Dil-LDL for binding at 4°C. Then the cells were washed 3 times with ice-chilled PBS. The cells were substantially switched to 37 °C for uptake. h Representative immunofluorescence microscopy images showing that Abcc4 knockout in AML12 cells had potentiated influence on DiI-LDL binding (0 h) and uptake (1 h). Blue: DAPI; Red: Dil-LDL. Scale bar: 50 μm. i Dil-LDL uptake assay implying that LDL uptake was significantly promoted in Abcc4-deficient cells by flow cytometry analysis (Representative data from n = 3 independent experiments with similar results). j The relative MFI of Dil-LDL quantification were from 3 independent experiments. k FC data showing that knockout of ABCC4 promotes the cell surface LDLR accessibility in LO2 cells (Representative data from n = 3 independent experiments with similar results). l The relative MFI of LDLR-PE quantification was from three independent experiments. m Immunoblotting analysis of LDLR quantification located on the plasma membrane fractions relative to Na/K-ATPase in LO2 cells. n Flow cytometry analysis showing that LDL uptake by LDLR was significantly promoted in LO2 cells lacking ABCC4 (Representative data from n = 3 independent experiments with similar results). o The relative MFI of Dil-LDL quantification were from three independent experiments. Statistical analysis was performed by a ordinary one-way ANOVA followed by Bonferroni’s multiple comparison test in (d), (f), (j), (l), (o). *P ≤ 0.05, **P ≤ 0.01, ***P ≤ 0.001, ****P ≤ 0.0001, ns: no significance. Data are the mean ± SEM. Source data are provided as a Source Data file.
Fig. 3
Fig. 3. Liver-specific disruption of ABCC4 promotes hepatic plasma membrane LDLR protein expression and lowers plasma LDL cholesterol levels in vivo.
a WT C57BL/6 male mice were treated with control AAV_GFP_RNAi or AAV_Abcc4_RNAi by tail vein injection (2×10¹¹ viral genomes per mouse, n = 6 per group) for 3 weeks. b Hepatic Abcc4 mRNA expression level in WT mice between two groups. c Representative immunoblotting data of hepatic ABCC4 protein expression level in WT mice between two groups. d Quantification of band intensity of ABCC4 protein level relative to Vinculin in liver tissue from two groups. e Representative immunoblotting data of membrane LDLR protein expression from liver tissue membrane fractions in mice. f Quantification of band intensity of membrane LDLR protein level relative to Na/K-ATPase in liver tissue from two groups. g Serum LDL-C level in WT mice between two groups. h Serum TC level in in WT mice between two groups. i Serum TG level in WT mice between two groups. Statistical analysis was performed by an unpaired two-tailed Student’s t-test in (b), (d), (f), (g), (h), (i). **P ≤ 0.01, ***P ≤ 0.001, ns: no significance. Data are the mean ± SEM. Source data are provided as a Source Data file.
Fig. 4
Fig. 4. Pharmacologic inhibition of ABCC4 by Ceefourin-1 facilitates plasma LDL cholesterol clearance by enhancing surface LDLR protein expression on hepatocytes.
a Flow cytometry data showing that ABCC4 inhibitor treatment potentiates surface LDLR availability (Representative data from n = 5 independent experiments with similar results). b Plot showing the relative Mean Fluorescence Intensity (MFI) of PE-LDLR from five independent experiments. c Immunoblotting experiments of the plasma membrane fractions demonstrating that ABCC4 inhibitor treatment up-regulates surface LDLR protein expression in AML12 cells. d Quantification of band intensity of surface LDLR protein expression relative to Na/K-ATPase in AML12 cells (Data from n = 3 independent experiments). e Wild-type male mice (n = 6 per group) were injected intraperitoneally three times a week with a dose of Ceefourin-1 (10 mg/kg) or vehicle control (DMSO and corn oil) for 4 weeks under normal-chow diet (NCD) or high-fat diet (HFD) conditions. f Plot displaying changes of body weight in mice intraperitoneally with vehicle control and ABCC4 inhibitor Ceefourin-1 under a NCD or HFD condition. g Serum LDL-C level in WT mice treated as in (e). h Serum TC level in WT mice treated as in (e). i Serum TG level in WT mice treated as in (e). j Liver TC level in WT mice treated as in (e). k Liver TG level in WT mice treated as in (e). l Hematoxylin and eosin (H&E) and Oil Red O staining analysis revealing that ABCC4 inhibitor treatment improved lipid accumulation, especially under a HFD condition. Scale bar: 50 μm. m Immunoblotting data of LDLR protein expression from liver plasma membrane fractions in NDC-fed mice treated with Ceefourin-1 or vehicle. n Representative immunoblotting data of LDLR expression from liver plasma membrane fractions in HFD-fed mice treated with Ceefourin-1 or vehicle. o Quantification of band intensity of LDLR protein level relative to Na/K-ATPase in liver plasma membrane fractions from the mice treated as in (e). Statistical analysis was performed by an unpaired two-tailed Student’s t-test in (b), (d); a ordinary one-way ANOVA followed by Bonferroni’s multiple comparison test in (g), (h), (i), (j), (k), (o). *P ≤ 0.5, **P ≤ 0.01, ***P ≤ 0.001, ****P ≤ 0.0001, ns: no significance. Data are the mean ± SEM. Source data are provided as a Source Data file.
Fig. 5
Fig. 5. Altered intracellular distribution of cAMP by ABCC4 blocks hepatic PCSK9 expression.
a Principal component analysis showing distinct clustering of transcriptomes of the samples between Abcc4-knockout (Abcc4 sgRNA) and control-knockout (Rosa26 sgRNA) AML12 cells. b Hierarchically clustered circos heatmap of top 43 differentially expressed genes (DEGs) between two groups (P < 0.05; fold change>2.0). c KEGG pathway enrichment analysis of DEGs. d, e GSEA showing activated cAMP (d) and Rap1 (e) signaling pathways for DEGs between two groups. f Heatmap showing the enriched pathways related to lipid metabolism process, insulin secretion signaling, cAMP signaling, cGMP-PKG signaling, and Rap1 signaling for DEGs. g ELISA measurements showing increased intracellular and reduced extracellular cAMP levels in Abcc4-deficient cells. h ELISA measurements showing increased intracellular and reduced extracellular cAMP levels in AML 12 cell treated with the ABCC4 inhibitor Ceefourin-1. i Immunoblotting experiments showing PCSK9 protein levels in Abcc4-deficient cells. j Quantification of band intensity of PCSK9 protein expression relative to Vinculin in Abcc4-deficient cells from three independent experiments. k Secreted PCSK9 levels in Abcc4-deficient cells. l RT-qPCR results assessing Pcsk9 mRNA level in Abcc4-deficient cells from three independent experiments. m Immunoblotting experiments showing PCSK9 protein level in AML12 cell treated with DMSO or Ceefourin-1. n Quantification of band intensity of PCSK9 protein level relative to Vinculin between two groups from three independent experiments. o Secreted PCSK9 levels in AML12 cells treated with DMSO or Ceefourin-1. p Pcsk9 relative mRNA expression level by RT-qPCR between two groups from three independent experiments. q Immunoblotting analysis of PCSK9 protein levels in Abcc4-deficient cells treated with cycloheximide (cyclo: 4 μg/mL) for 30 min (+) and 90 min (++). r Flow cytometry analysis of Dil-LDL uptake assay (1 h) in Abcc4-deficient cells treated with Vehicle or rhPCSK9 protein. The relative MFI of Dil-LDL quantification were from three independent experiments. s Immunoblotting analysis of LDLR expression from the plasma membrane fractions in Abcc4-deficient cells. Statistical analysis was performed by a Welch ANOVA test followed by a post hoc analysis using the Tamhane T2 method in (g); an unpaired two-tailed Student’s t-test in (h), (n), (o), (p); a ordinary one-way ANOVA followed by Bonferroni’s multiple comparison test in (j), (k), (l), (r). *P ≤ 0.5, **P ≤ 0.01, ***P ≤ 0.001, ****P ≤ 0.0001, ns: no significance. Data are the mean ± SEM. Source data are provided as a Source Data file.
Fig. 6
Fig. 6. ABCC4-cAMP signaling regulating cell surface LDLR availability is dependent on essential roles of Epac2/Rap1a.
a Generation of Abcc4/Epac2 double-knockout (DKO) AML12 cells using two sgRNAs targeting Epac2 gene. Immunoblotting analysis of ABCC4, EPAC2 and Vinculin protein expression in AML12 cells (Rosa26 sgRNA, Abcc4 sgRNA #1, Abcc4 sgRNA #2, Abcc4/Epac2 sgRNA #1, Abcc4/Epac2 gRNA #2). b Immunoblotting analysis of LDLR protein expression from the plasma membrane fractions in AML12 cells (Rosa26 sgRNA, Abcc4 sgRNA #1, Abcc4 sgRNA #2, Abcc4/Epac2 sgRNA #1, Abcc4/Epac2 gRNA #2). c Flow cytometry analysis of Dil-LDL uptake assay (1 h) in AML12 cells (Rosa26 sgRNA, Abcc4 sgRNA, Abcc4/Epac2 sgRNA). d The relative MFI of Dil-LDL quantification were from 3 independent experiments. e Immunoblotting analysis of PCSK9 protein expression in AML12 cells (Rosa26 sgRNA, Abcc4 sgRNA #1, Abcc4 sgRNA #2, Abcc4/Epac2 sgRNA #1, Abcc4/Epac2 gRNA #2). f Secreted PCSK9 levels in AML12 cells (Rosa26 sgRNA, Abcc4 sgRNA, Abcc4/Epac2 sgRNA) from four independent experiments. g Relative Pcsk9 mRNA expression level in AML12 cells (Rosa26 sgRNA, Abcc4 sgRNA, Abcc4/Epac2 sgRNA) from four independent experiments. h Generation of Abcc4/Rap1a DKO AML12 cells using two independent sgRNAs targeting Rap1a gene. Immunoblotting analysis of ABCC4, RAP1A and Vinculin protein expression in AML12 cells (Rosa26 sgRNA, Abcc4 sgRNA #1, Abcc4 sgRNA #2, Abcc4/Rap1a sgRNA #1, Abcc4/Rap1a sgRNA #2). i Immunoblotting analysis of LDLR protein expression from the plasma membrane fractions in AML12 cells (Rosa26 sgRNA, Abcc4 sgRNA #1, Abcc4 sgRNA #2, Abcc4/Rap1a sgRNA #1, Abcc4/Rap1a sgRNA #2). j Flow cytometry analysis of Dil-LDL uptake assay (1 h) in AML12 cells (Rosa26 sgRNA, Abcc4 sgRNA, Abcc4/Rap1a sgRNA). k The relative MFI of Dil-LDL quantification were from 3 independent experiments. l Immunoblotting analysis of PCSK9 protein expression in AML12 cells (Rosa26 sgRNA, Abcc4 sgRNA #1, Abcc4 sgRNA #2, Abcc4/Rap1a sgRNA #1, Abcc4/Rap1a sgRNA #2). m Secreted PCSK9 levels in AML12 cells (Rosa26 sgRNA, Abcc4 sgRNA, Abcc4/Rap1a sgRNA) from four independent experiments. n Relative Pcsk9 mRNA expression level in AML12 cells (Rosa26 sgRNA, Abcc4 sgRNA, Abcc4/Rap1a sgRNA) from four independent experiments. Statistical analysis was performed by a Welch ANOVA test followed by a post hoc analysis using the Tamhane T2 method in (d), (k); a ordinary one-way ANOVA followed by Bonferroni’s multiple comparison test in (f), (g), (m), (n). *P ≤ 0.5, **P ≤ 0.01, ***P ≤ 0.001, ****P ≤ 0.0001, ns: no significance. Data are the mean ± SEM. Source data are provided as a Source Data file.

References

    1. Navarese, E. et al. Association between baseline LDL-C level and total and cardiovascular mortality after LDL-C lowering: a systematic review and meta-analysis. JAMA319, 1566–1579 (2018). - PMC - PubMed
    1. Ko, D. S. & Kim, Y. H. Mendelian randomization studies in atherosclerotic cardiovascular diseases. J. lipid atherosclerosis13, 280–291 (2024). - PMC - PubMed
    1. Lorkowski, S. & Cullen, P. Atherosclerosis: pathogenesis, clinical features and treatment. Encycl. Life Sci.10, 1–11 (2007).
    1. Helkin, A. et al. Dyslipidemia part 1-review of lipid metabolism and vascular cell physiology. Vasc. Endovasc. Surg.50, 107–118 (2016). - PubMed
    1. Alfarisi, H. A. H., Mohamed, Z. B. H. & Ibrahim, M. B. Basic pathogenic mechanisms of atherosclerosis. Egypt. J. Basic Appl. Sci.7, 116–125 (2020).

MeSH terms