. 2025 Oct 2;15(1):34419.
doi: 10.1038/s41598-025-17448-6.

Normothermic machine perfusion converges transplant induced transcript profiles in low and high risk DBD and DCD livers

Affiliations

Normothermic machine perfusion converges transplant induced transcript profiles in low and high risk DBD and DCD livers

Karen S Keslar et al. Sci Rep. .

Abstract

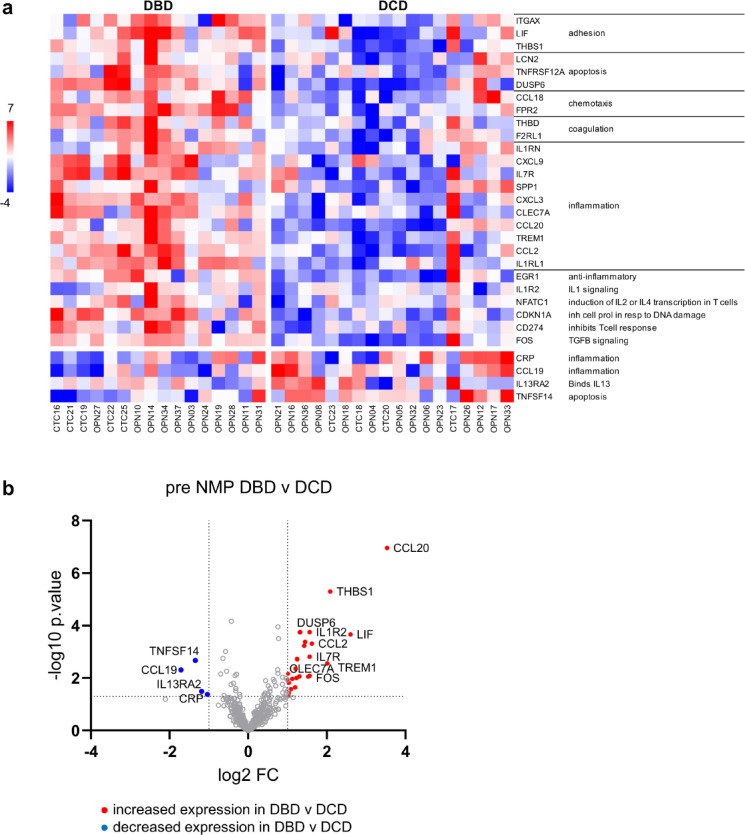
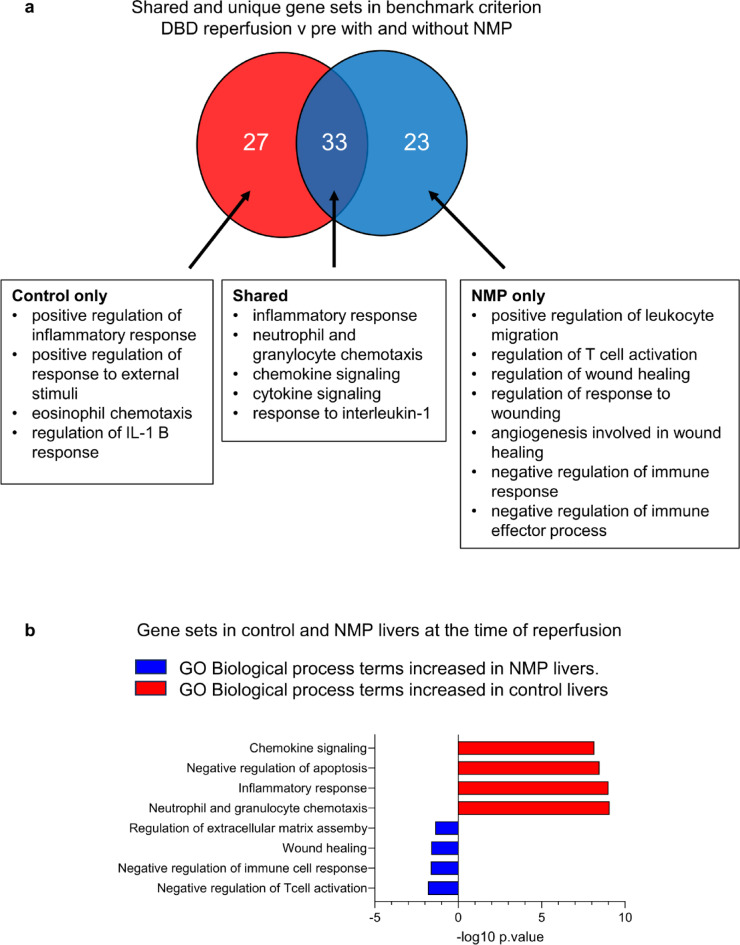
Normothermic machine perfusion (NMP) of donated livers is emerging as a superior preservation technology versus static cold storage (SCS) for transplant, transforming a metabolically dormant organ to a functioning state that improves outcomes of marginal liver transplants. Mechanisms underlying improved NMP restoration of donation after brain death (DBD) and donation after circulatory death (DCD) livers remain incompletely defined. We tested the hypothesis that NMP would decrease transcripts encoding inflammatory mediators following both perfusion and transplant of DBD and DCD livers. Biopsy transcript expression profiles were determined from SCS DBD livers at pre-SCS preservation and transplant reperfusion and from benchmark and outside benchmark criteria DBD and DCD livers pre-NMP, after 6-7 h of NMP, and after transplant reperfusion. Compared to SCS livers, NMP programs converged transcript profiles of DCD and DBD livers, decreasing transplant reperfusion-induced inflammatory transcripts while increasing transcripts promoting wound healing and tissue repair processes, but did not obviate the high occurrence of adverse events in the outside benchmark DCD livers transplants.

Keywords: Gene expression; Graft preservation; Inflammation; Ischemia-reperfusion injury; Liver transplantation.


Conflict of interest statement

Declarations. Competing interests: The authors declare no competing interests.

Figures

Fig. 1
Fig. 1
Blue arrows indicate sample collection points. (a) Biopsy samples from 34 livers treated with normothermic machine perfusion (NMP) were collected at three timepoints: pre-SCS or NMP preservation, before the beginning of machine perfusion; post-NMP, after completion of machine perfusion; and reperfusion, after transplantation into the recipient, just before closure. Twenty of the NMP livers were from benchmark criterion donors, 10 donation after brain death (DBD) and 10 donation after cardiac death (DCD). Fourteen NMP livers were from outside benchmark criterion donors, 6 DBD and 8 DCD. (b) Biopsy samples from 13 control livers were collected at two timepoints: baseline (pre), after dissection, while the liver was on the back table in the operating room; and reperfusion, after transplantation into the recipient, before closure. All of the control livers were from benchmark criterion DBD donors. Abbreviations: DBD, donation after brain death; DCD, donation after cardiac death; NMP, normothermic machine perfusion.
Fig. 2
Fig. 2
Baseline gene expression reveals increased inflammatory transcript profiles in DBD versus DCD livers. (a) Gene expression was measured by NanoString in 16 DBD and 18 DCD livers prior to machine perfusion. Differently expressed genes were defined by log2 fold-change ≥ 1 or ≤ -1 and p value ≤ 0.05. (a) Heatmap indicating higher expression of 26 genes and decreased expression of 4 genes in the DBD livers when compared to the DCD livers at baseline. (b) volcano plot showing the differently expressed genes. The horizontal dotted line on the volcano plot is p value = 0.05. The two vertical dotted lines are log2 fold-change − 1 and 1. Red dots indicate DEGs with increased expression in DBD livers compared with DCD livers and blue dots indicate DEGs with decreased expression in DBD livers. Abbreviations: DBD, donation after brain death; DCD, donation after cardiac death; NMP, normothermic machine perfusion.
Fig. 3
Fig. 3
Transplant reperfusion induces different gene expression changes from baseline to reperfusion in control SCS and NMP conditioned livers. (a) Heatmap indicating gene expression changes between baseline and reperfusion biopsies measured by NanoString in 13 control SCS conditioned benchmark criterion DBD livers and 10 NMP benchmark criterion DBD livers. DEGs were defined by log2 fold-change ≥ 1 or ≤ -1 and p value ≤ 0.05 with 60 DEGs with increased expression after reperfusion in control SCS livers. (b) Volcano plot illustrates the 27 DEGs that were unique to the control SCS group in red and 33 shared DEGs upregulated in both control SCS and NMP conditioned benchmark criterion DBD livers in blue. The horizontal dotted line on each volcano plot is p value = 0.05. The two vertical dotted lines are log2 fold-change − 1 and 1. (c) Heatmap showing the 56 genes with increased expression and 4 genes with decreased expression after reperfusion in NMP benchmark criterion DBD livers. (d) Volcano plot illustrates in red 23 genes increased and 4 genes decreased only in NMP livers, and in blue the 33 genes increased in both control and NMP benchmark criterion DBD livers. Abbreviations: BM, benchmark criterion; DBD, donation after brain death; DEG, differently expressed gene; NMP, normothermic machine perfusion; SCS, static cold storage.
Fig. 4
Fig. 4
Wound healing and anti-inflammatory gene sets are increased between baseline and reperfusion in NMP-conditioned livers but not control livers. (a) Gene expression changes between baseline and reperfusion were determined for 13 control and 10 NMP benchmark criterion DBD livers. The Venn diagram indicates the numbers of shared and unique DEGs with increased expression at the time of reperfusion compared with baseline. GO biological pathways that are unique to the control group, unique to the NMP group, and common to both groups are listed. (b) Gene expression at the time of reperfusion was measured by NanoString in 13 control and 10 NMP benchmark criterion DBD livers. Differently expressed genes were defined by log2 fold-change ≥ 1 or ≤ -1 and p value ≤ 0.05. Ten genes were increased in NMP livers relative to control, SCS livers and 25 genes were decreased (see supplemental Fig. 1). Pathway analysis was done in ENRICHR and the most highly significant GO biological pathways were determined. GO biological pathways increased in control, SCS livers are shown in red and those increased in NMP livers are shown in blue. Bars represent the Benjamini-Hochberg adjusted p value. Abbreviations: DBD, donation after brain death; DCD, donation after cardiac death; DEG, differently expressed gene; GO, gene ontology; NMP, normothermic machine perfusion; SCS, static cold storage.
Fig. 5
Fig. 5
Inflammatory gene expression has greater increases in post-NMP and transplant reperfusion biopsies from DCD livers versus DBD livers. Gene expression changes between post-NMP and transplant reperfusion were determined by NanoString for liver biopsy samples from each of the four donor groups: 10 BM DBD, 10 BM DCD, 6 OSBM DBD, and 8 OSBM DCD. DEGs were defined by log2 fold-change ≥ 1 or ≤ -1 and p value ≤ 0.05. (a, b) Volcano plots show unique and shared inflammatory DEGs in solid and open red, respectively, and unique and shared wound healing and anti-inflammatory DEGs in solid and open blue. The horizontal dotted line on each volcano plot is p value = 0.05. The two vertical dotted lines are log2 fold-change − 1 and 1. (c) Venn diagrams indicate numbers of shared and unique DEGs when comparing DBD to DCD livers. Abbreviations: BM, benchmark criterion; DBD, donation after brain death; DCD, donation after cardiac death; DEG, differently expressed gene; NMP, normothermic machine perfusion; OSBM, outside benchmark criterion.
Fig. 6
Fig. 6
At the time of reperfusion, SCS and NMP livers express distinct transcript profiles. Gene expression at the time of reperfusion was measured by NanoString in 13 livers from control BM DBD donors and all 34 NMP livers. DEGs were defined by log2 fold-change ≥ 1 or ≤ -1 and p value ≤ 0.05. (a) The heatmap illustrates the 12 genes with increased expression in control livers and 16 genes with increased expression in NMP livers. (b) The PCA plot shows separation between control SCS and NMP livers but not between the 4 NMP groups. Abbreviations: BM, benchmark criterion; DBD, donation after brain death; DCD, donation after cardiac death; NMP, normothermic machine perfusion; PCA, principal component analysis; OSBM, outside benchmark criterion; SCS, static cold storage.

References

    1. Wolfe, R. A., Merion, R. M., Roys, E. C. & Port, F. K. Trends in organ donation and transplantation in the united states, 1998–2007. Am. J. Transpl.9, 869–878 (2009). - PubMed
    1. Yi, Z. et al. Trends in characteristics of patients listed for liver transplantation will lead to higher rates of removal due to clinical deterioration. Transplantation101, 2368–2374 (2017). - PMC - PubMed
    1. Rana, R. et al. Predicting liver allograft discard: the discard risk index. Transplantation102, 1520–1529 (2018). - PubMed
    1. Malik, T. et al. Pediatric discard risk index for predicting pediatric liver allograft discard. Pediatr. Transpl.e1396310.1111/petr.13963 (2021). - PubMed
    1. Patrono, D. et al. Viability assessment and transplantation of fatty liver grafts using end-ischemic normothermic machine perfusion. Liver Transpl.29, 508–520 (2023). - PMC - PubMed

LinkOut - more resources