. 2025 Oct 2;30(1):109.
doi: 10.1186/s11658-025-00785-9.

RSL3 promotes PARP1 apoptotic functions by distinct mechanisms during ferroptosis

Affiliations

RSL3 promotes PARP1 apoptotic functions by distinct mechanisms during ferroptosis

Dejian Chen et al. Cell Mol Biol Lett. .

Abstract

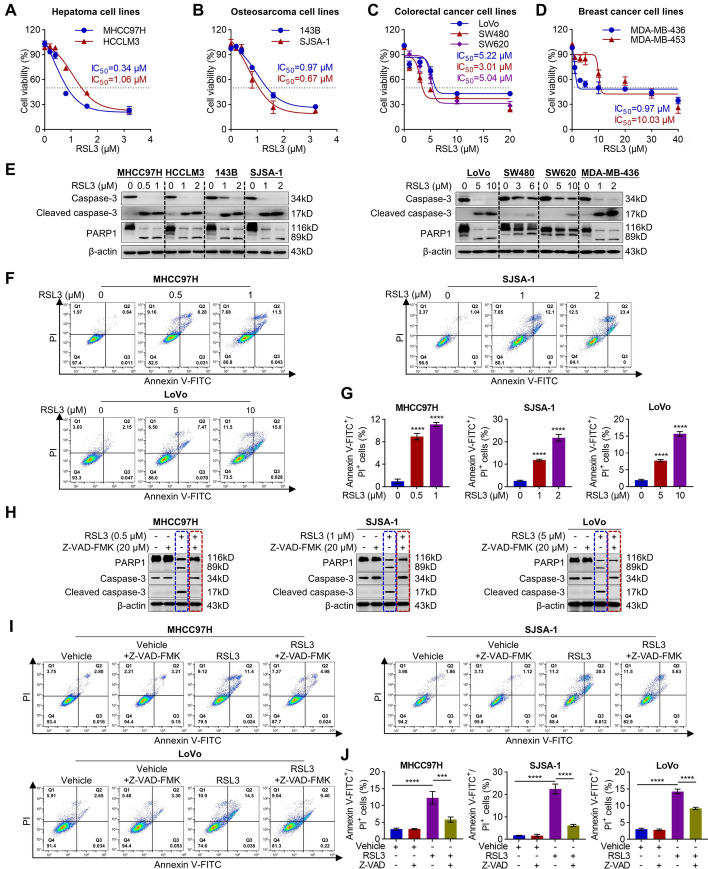
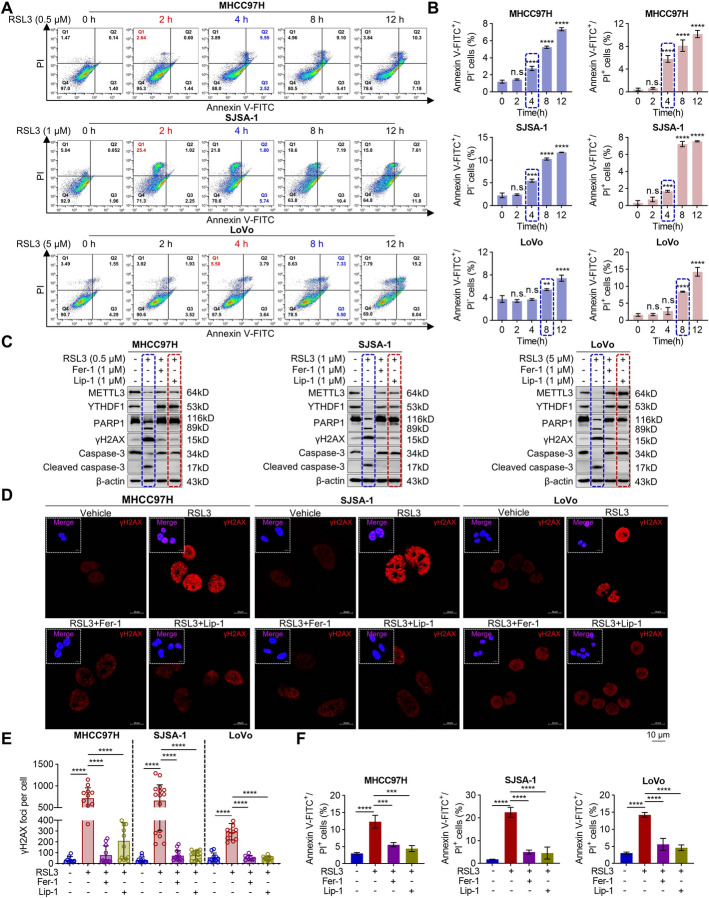
Background: The classical ferroptosis activator RSL3 targets enzymes with nucleophilic active sites, primarily acting on glutathione peroxidase 4 (GPX4) to trigger ferroptosis. Recent studies identify RSL3 as a potential pro-apoptotic agent. However, the mechanism by which RSL3 induces apoptosis during ferroptosis remains elusive. Poly(ADP-ribose) polymerase (PARP1) determines cell fate in response to DNA damage, where its loss or cleavage by activated caspase-3 induces apoptosis to attenuate tumor progression. We elucidate a novel mechanism underlying PARP1 regulation, encompassing both its caspase-dependent cleavage and full-length depletion during RSL3-mediated ferroptosis-apoptosis crosstalk.

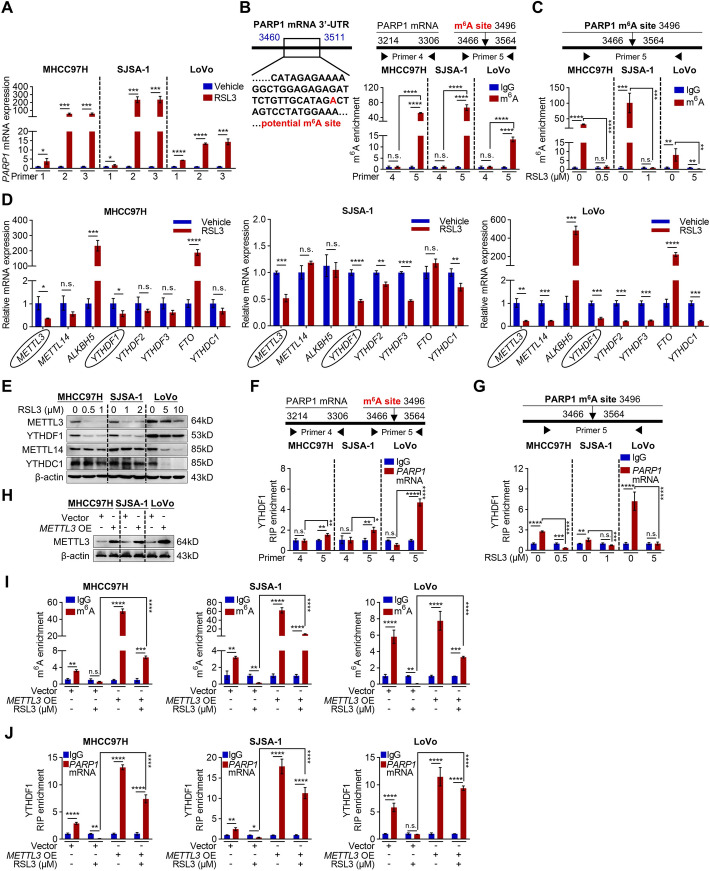
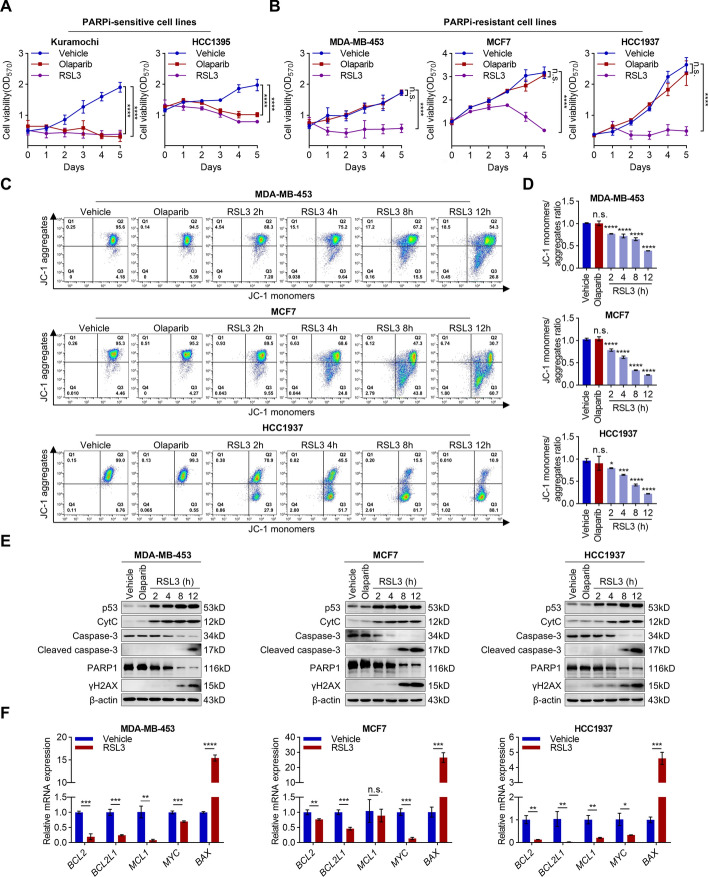
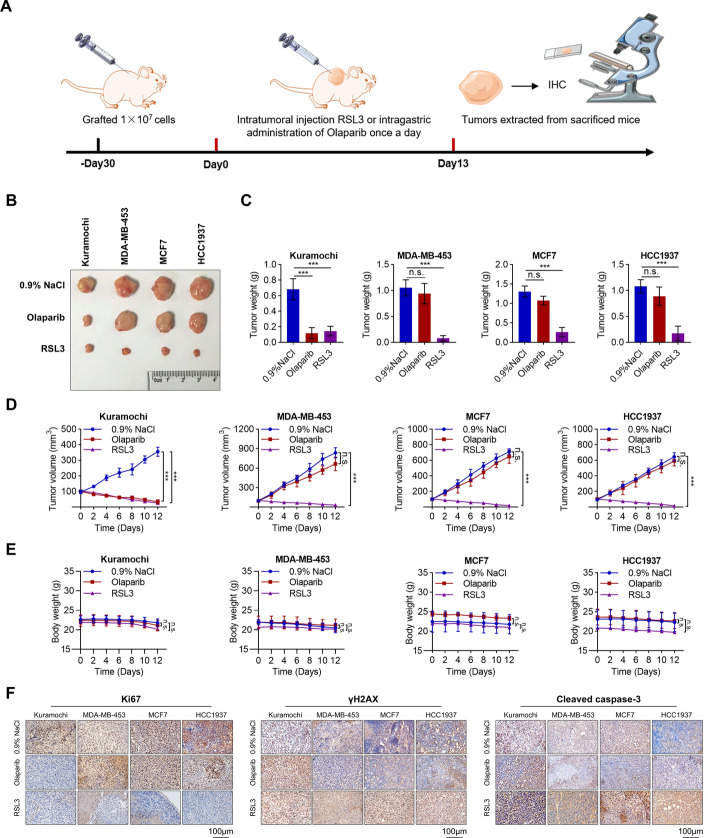
Methods: To investigate the role of RSL3 during ferroptosis, we treated several cancer cells of different histological types with varying doses of RSL3 to induce apoptosis. The regulatory proteins of PARP1 were analyzed using real-time quantitative polymerase chain reaction (RT-qPCR) and Western blot analysis. The N6-methyladenosine (m6A) modification level of PARP1 was determined by m6A RNA immunoprecipitation (MeRIP)-qPCR analysis. Additionally, an RNA immunoprecipitation (RIP)-qPCR assay was performed to identify the target protein of the m6A site of PARP1. Furthermore, we established a mouse xenograft model of PARP inhibitor (PARPi)-resistant cells to analyze the effect of RSL3 on PARPi-resistant tumor growth.

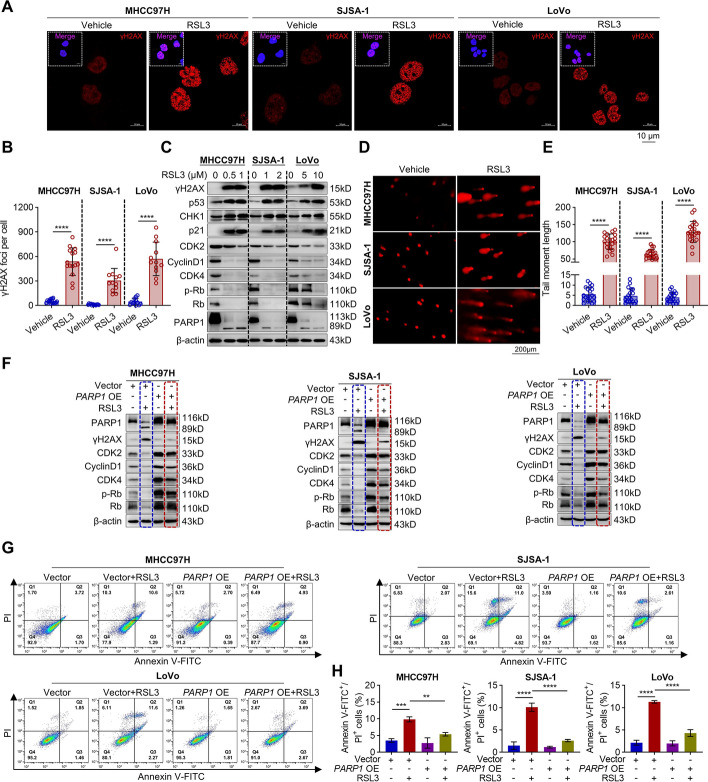
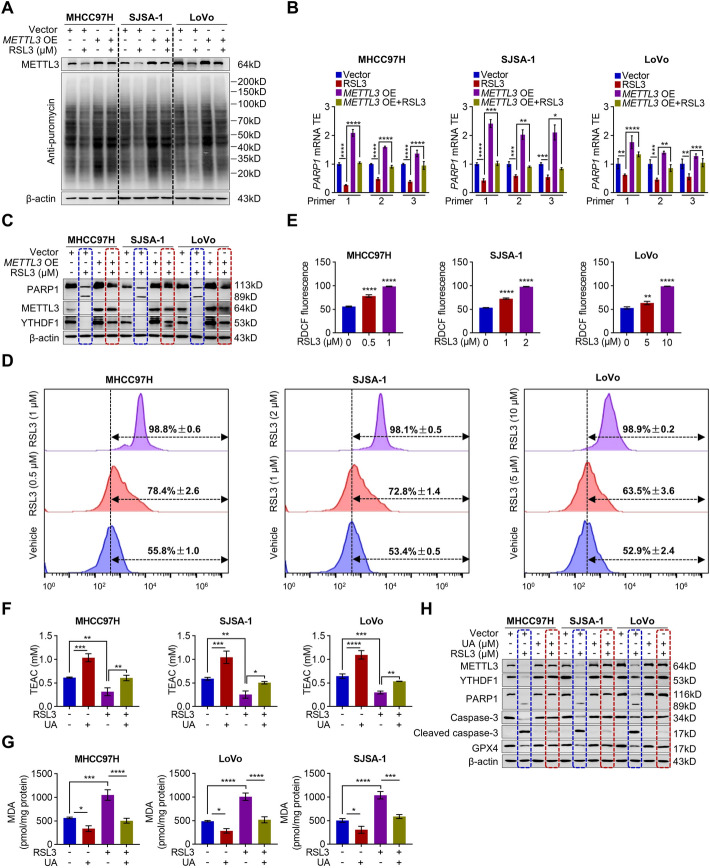
Results: RSL3 triggers two parallel apoptotic pathways via increasing reactive oxygen species (ROS) production during ferroptosis: (1) caspase-dependent PARP1 cleavage and (2) DNA damage-dependent apoptosis resulting from reduced full-length PARP1. The latter occurs through inhibition of METTL3-mediated m6A modification and subsequent suppression of PARP1 translation. Moreover, we found that RSL3 retains pro-apoptotic functions in PARPi-resistant cells and effectively inhibits PARPi-resistant xenograft tumor growth in vivo.

Conclusions: RSL3 orchestrates ferroptosis-apoptosis crosstalk via PARP1, demonstrating therapeutic potential against tumorigenesis, particularly in PARPi-resistant malignancies.

Keywords: N 6-methyladenosine; Apoptosis; PARP1; PARPi-resistant tumor; RSL3.


Conflict of interest statement

Declarations. Ethics approval and consent to participate: All animal protocols in this study were performed in accordance with the Institutional Animal Care and Use Committee, University Laboratory Animal Research of Wenzhou Medical University (no. wydw2024-0522, 25 January 2024) that acts on the International Council for Laboratory Animal Science (ICLAS). Consent for publication: All the authors have provided their consent for publication of the manuscript. Competing interests: The authors have no conflicts of interest to declare.

Figures

Fig. 1
Fig. 1
RSL3 induces PARP1 cleavage and caspase-dependent apoptosis. AD IC50 values were determined for hepatoma (A), osteosarcoma (B), colorectal cancer (C), and breast cancer (D) cell lines treated with increasing doses of RSL3 for 12 h using MTT cellular proliferation and cytotoxicity assay kits (n = 6). E Western blot analysis of PARP1, caspase 3, and cleaved caspase-3 protein levels in cells treated RSL3 at concentrations above their respective IC50 values. F, G Flow cytometry analysis of apoptosis in hepatoma MHCC97H, osteosarcoma SJSA-1, and colorectal cancer LoVo cells treated with gradient doses of RSL3 for 12 h (F). Quantified apoptosis rates were statistically analyzed (G). Data are presented as mean ± SD and statistical significance was assessed by one-way ANOVA with Bonferroni post-test (n = 3, ****P < 0.0001). H Western blot analysis of PARP1, caspase 3, and cleaved caspase-3 protein levels in cells treated with RSL3 (MHCC97H: 0.5 µM; SJSA-1: 1 µM; LoVo: 5 µM) and Z-VAD-FMK (20 µM) for 12 h. I, J Apoptosis rates in cells co-treated with RSL3 and Z-VAD-FMK for 12 h were assessed by Annexin V-FITC/PI staining and flow cytometry (I). Quantified apoptosis rates were statistically analyzed (J). Data are presented as mean ± SD, and statistical significance was assessed by one-way ANOVA with Bonferroni post-test (n = 3, ***P < 0.001, ****P < 0.0001)
Fig. 2
Fig. 2
RSL3 decreases full-length PARP1 levels to induce DNA damage-dependent apoptosis. A, B Representative images of γH2AX foci and DAPI-stained nuclei in MHCC97H, SJSA-1, or LoVo cells treated with RSL3 (MHCC97H: 0.5 µM; SJSA-1: 1 µM; LoVo: 5 µM) for 12 h (scale bars, 10 µm) (A). γH2AX foci per cell was quantified using ImageJ Plus software (B). Data are presented as mean ± SD and statistical significance was assessed by two-tailed unpaired Student’s t-test (n > 3, ****P < 0.0001). C Western blot analysis of DNA damage- and cell cycle arrest-associated proteins in cells treated with various concentrations of RSL3 for 12 h. D, E DNA damage was directly assessed by comet assay under the same conditions as panel A (D). Comet parameters were quantified using CASP analysis, with tail length, intensity, and tail moment expressed relative to head measurements (E). Data are presented as mean ± SD and statistical significance was assessed by two-tailed unpaired Student’s t-test (n > 3, ****P < 0.0001). F Western blot analysis of DNA damage- and cell cycle arrest-associated proteins in vector control and PARP1-overexpressing cells treated with RSL3 (MHCC97H: 0.5 µM; SJSA-1: 1 µM; LoVo: 5 µM) for 12 h. G, H Apoptosis rates in vector control and PARP1-overexpressing cells treated with RSL3 for 12 h were assessed by Annexin V-FITC/PI staining and flow cytometry (G). Quantified late apoptosis rates were statistically analyzed (H). Data are presented as mean ± SD, and statistical significance was assessed by one-way ANOVA with Bonferroni post-test (n = 3, **P < 0.01, ***P < 0.001, ****P < 0.0001)
Fig. 3
Fig. 3
RSL3 reduces PARP1 m6A modification via the METTL3–YTHDF1 pathway. A PARP1 mRNA was detected by RT-qPCR following treatment with RSL3 for 12 h. Data are presented as mean ± SD, and statistical significance was assessed by multiple t-test (n = 3, *P < 0.05, ***P < 0.001, ****P < 0.0001). B Schematic of predicted PARP1 m6A site. The abundance of PARP1 RNA (50 µg) immunoprecipitated with m6A was measured by RT-qPCR and normalized to IgG. Data are presented as mean ± SD, and statistical significance was assessed by two-way ANOVA with Tukey’s post-test (n = 3, ****P < 0.0001, or n.s.: not significant). C The abundance of PARP1 RNA (50 µg) immunoprecipitated with m6A following treatment with RSL3 for 12 h was measured by RT-qPCR and normalized to IgG. Data are presented as mean ± SD, and statistical significance was assessed by two-way ANOVA with Tukey’s post-test (n = 3, **P < 0.01, ***P < 0.001, ****P < 0.0001, or n.s.: not significant). D RT-qPCR analysis of RNA methylases, demethylases, and their downstream readers. Data are presented as mean ± SD, and statistical significance was assessed by multiple t-tests (n = 3, *P < 0.05, **P < 0.01, ***P < 0.001, ****P < 0.0001, or n.s.: not significant). E Western blot analysis of RNA methylase and its reader protein expression after RSL3 treatment for 12 h. F RIP analysis of PARP1 mRNA-YTHDF1 protein interaction and normalized to IgG. Data are presented as mean ± SD, and statistical significance was assessed by two-way ANOVA with Tukey’s post-test (n = 3, *P < 0.05, **P < 0.01, ****P < 0.0001, or n.s.: not significant by unpaired Student’s t test). G Abundance of PARP1 mRNA immunoprecipitated with YTHDF1 following RSL3 treatment for 12 h was detected by RT-qPCR and normalized to IgG. Data are presented as mean ± SD, and statistical significance was assessed by two-way ANOVA with Tukey’s post-test (n = 3, **P < 0.01, ***P < 0.001, ****P < 0.0001, or n.s.: not significant). H Western blot verification of METTL3 overexpression efficiency. I PARP1 m6A levels in METTL3-overexpressing cells treated with RSL3 (MHCC97H: 0.5 µM; SJSA-1: 1 µM; LoVo: 5 µM) for 12 h were analyzed by MeRIP-qPCR. Owing to METTL3 overexpression increasing m6A levels, the abundance of PARP1 RNA (20 µg) immunoprecipitated with m6A was measured by RT-qPCR and normalized to IgG. Data are presented as mean ± SD, and statistical significance was assessed by two-way ANOVA with Tukey’s post-test (n = 3, **P < 0.01, ***P < 0.001, ****P < 0.0001, or n.s.: not significant). J RIP-qPCR analysis of PARP1 m6A levels and YTHDF1 binding in METTL3-overexpressing cells treated with RSL3 (MHCC97H: 0.5 µM; SJSA-1: 1 µM; LoVo: 5 µM) for 12 h and normalized to IgG. Data are presented as mean ± SD, and statistical significance was assessed by two-way ANOVA with Tukey’s post-test (n = 3, *P < 0.05, **P < 0.01, ****P < 0.0001, or n.s.: not significant)
Fig. 4
Fig. 4
RSL3 decreases lipid peroxidation to attenuate METTL3-mediated PARP1 protein translation and cleavage. A Protein translation efficacy was assessed by puromycin intake assay in vector control and METTL3-overexpressing cells treated with RSL3 (MHCC97H: 0.5 µM; SJSA-1: 1 µM; LoVo: 5 µM) for 12 h, followed by puromycin (10 µg/ml) for 20 min. B PARP1 mRNA translation efficacy (TE) was measured by RT-qPCR analysis of polyribosome-associated mRNAs under the same conditions as panel A. Data are presented as mean ± SD, and statistical significance was assessed by two-way ANOVA with Tukey’s post-test (n = 3, *P < 0.05, **P < 0.01, ***P < 0.001, ****P < 0.0001). C Western blot analysis of PARP1 and YTHDF1 protein levels under the same conditions as panel A. D, E Intracellular ROS levels were detected by DCF fluorescence using flow cytometry in RSL3-treated and untreated cells (D). DCF fluorescence intensity was quantified using GraphPad 8.0. Data are presented as mean ± SD, and statistical significance was assessed by one-way ANOVA with Bonferroni post-test (n = 3, **P < 0.01, ****P < 0.0001) (E). F, G The TEAC (F) and MDA content (G) were measured after co-treatment with RSL3 (MHCC97H: 0.5 µM; SJSA-1: 1 µM; LoVo: 5 µM) and UA (500 µM) for 24 h. TEAC values were normalized to Trolox standards. Data are presented as mean ± SD, and statistical significance was assessed by one-way ANOVA with Bonferroni post-test (n = 3, *P < 0.05, **P < 0.01, ***P < 0.001, ****P < 0.0001). H Western blot analysis of METTL3, YTHDF1, PARP1, caspase-3, and GPX4 protein levels in indicated cells under the same conditions as panel F
Fig. 5
Fig. 5
Ferroptosis inhibitors attenuate PARP1-mediated caspase- and DNA damage-dependent apoptosis induced by RSL3. A Apoptosis rate in cells treated with RSL3 for 0–12 h were assessed by Annexin V-FITC/PI staining and flow cytometry. B Representative plots showing early apoptosis rates (Annexin V-FITC+/PI, left panel) and late apoptosis rates (Annexin V-FITC+/PI+, right panel). Data are presented as mean ± SD, and statistical significance was assessed by one-way ANOVA with Bonferroni post-test (n = 3, **P < 0.01, ***P < 0.001, ****P < 0.0001, or n.s.: not significant). C Western blot analysis of METTL3, YTHDF1, PARP1, γH2AX, caspase-3, and cleaved caspase-3 levels in cells co-treated with RSL3 (MHCC97H: 0.5 µM; SJSA-1: 1 µM; LoVo: 5 µM) and either Fer-1 (1 µM) or Lip-1 (1 µM) for 12 h. D, E Representative immunofluorescence images of γH2AX foci and DAPI-stained nuclei in cells under the same conditions as panel C (scale bars, 10 µm) (D). γH2AX foci per cell were quantified using ImageJ Plus software (E). Data are presented as mean ± SD, and statistical significance was assessed by one-way ANOVA with Bonferroni post-test (n > 3, ****P < 0.0001). F Flow cytometry analysis of apoptosis rates in cells under the same conditions as panel C and stained with Annexin V-FITC/PI. Data are presented as mean ± SD, and statistical significance was assessed by one-way ANOVA with Bonferroni post-test (n = 3, ***P < 0.001, ****P < 0.0001, or n.s.: not significant by unpaired Student’s t test)
Fig. 6
Fig. 6
RSL3 retains a pro-apoptotic function in PARPi-resistant cells. A, B Cell viability was assessed using MTT cellular proliferation and cytotoxicity assay kits in PARPi-sensitive (A) and PARPi-resistant (B) cells treated for 5 days with either RSL3 (Kuramochi: 1 µM; HCC1395: 1 µM; MDA-MB-453: 6 µM; MCF7: 4 µM; HCC1937: 5 µM) or PARPi (PARPi-sensitive cells: 5 µM; PARPi-resistant cells: 50 µM). Data are presented as mean ± SD, and statistical significance was assessed by two-way ANOVA with Tukey’s post-test (n = 6, ****P < 0.0001, or n.s.: not significant). C, D Mitochondrial membrane potential was analyzed by JC-1 staining and flow cytometry in cells treated with RSL3 for 0–12 h or PARPi for 12 h at concentrations shown in panel A (C). The JC-1 monomers/aggregates ratio (PE/FITC) was quantified and statistically analyzed (D). Data are presented as mean ± SD, and statistical significance was assessed by one-way ANOVA with Bonferroni post-test (n = 3, *P < 0.05, ***P < 0.001, ****P < 0.0001, or n.s.: not significant). E Western blot analysis of apoptosis- and DNA damage-related proteins in PARPi-resistant cells treated with either RSL3 (MDA-MB-453: 6 µM; MCF7: 4 µM; HCC1937: 5 µM) for 0–12 h or PARPi (50 µM) for 12 h. F RT-qPCR analysis of apoptosis-related gene expression in PARPi-resistant cells treated with RSL3 (MDA-MB-453: 6 µM; MCF7: 4 µM; HCC1937: 5 µM) for 12 h. Data are presented as mean ± SD, and statistical significance was assessed by multiple t-tests (n = 3, *P < 0.05, **P < 0.01, ***P < 0.001, ****P < 0.0001, or n.s.: not significant)
Fig. 7
Fig. 7
RSL3 inhibits PARPi-resistant xenograft tumor growth in vivo. A Schematic of the xenograft tumor model. BE Tumor-bearing nude mice received either intratumoral RSL3 injections (100 mg/kg) or intragastric olaparib administration (20 mg/kg) (n = 5 per group). Representative images of dissected tumors (B). Tumor weight after 12 consecutive days of treatment with 0.9% NaCl (control), olaparib, or RSL3 (C). Data are presented as mean ± SD, and statistical significance was assessed by one-way ANOVA with Bonferroni post-test (n = 5, ***P < 0.001 or n.s.: not significant). Tumor volume was measured every 2 days during treatment (D). Data are presented as mean ± SD, and statistical significance was assessed by one-way ANOVA with Bonferroni post-test (n = 5, ***P < 0.001 or n.s.: not significant). Body weight changes during treatment (E). Data are shown as mean ± SD, and statistical significance was assessed by one-way ANOVA with Bonferroni post-test (n = 5, n.s.: not significant). F Immunohistochemical staining of Ki67, γH2AX, and cleaved caspase-3 in xenograft tumors treated with 0.9% NaCl, olaparib, or RSL3 (scale bar, 100 µm)

References

    1. Dixon S, Lemberg K, Lamprecht M, Skouta R, Zaitsev E, Gleason C, et al. Ferroptosis: an iron-dependent form of nonapoptotic cell death. Cell. 2012;149(5):1060–72. - PMC - PubMed
    1. Landes T, Martinou JC. Mitochondrial outer membrane permeabilization during apoptosis: the role of mitochondrial fission. Biochim Biophys Acta. 2011;1813(4):540–5. - PubMed
    1. Costa I, Barbosa D, Benfeito S, Silva V, Chavarria D, Borges F, et al. Molecular mechanisms of ferroptosis and their involvement in brain diseases. Pharmacol Ther. 2023;244: 108373. - PubMed
    1. Huang C, Yang M, Deng J, Li P, Su W, Jiang R. Upregulation and activation of p53 by erastin-induced reactive oxygen species contribute to cytotoxic and cytostatic effects in A549 lung cancer cells. Oncol Rep. 2018;40(4):2363–70. - PubMed
    1. Liu L, Yang C, Zhu L, Wang Y, Zheng F, Liang L, et al. RSL3 enhances ROS-mediated cell apoptosis of myelodysplastic syndrome cells through MYB/Bcl-2 signaling pathway. Cell Death Dis. 2024;15(7):465. - PMC - PubMed