. 2025 Oct 2;23(1):412.
doi: 10.1186/s12964-025-02390-x.

A comparative proteomic, transcriptomic and glycomic analysis of extracellular vesicle isolation techniques highlights ExoGAG efficiency for a more complete identification of breast milk molecular signaling pathways

Affiliations

A comparative proteomic, transcriptomic and glycomic analysis of extracellular vesicle isolation techniques highlights ExoGAG efficiency for a more complete identification of breast milk molecular signaling pathways

María Pereira-Hernández et al. Cell Commun Signal. .

Abstract

Background: Human milk (HM) is the first form of communication between mothers and newborns and it is implicated in the infant growth and protection. We recently showed a functional characterization of HM, unmasking the molecular mechanisms related to EVs signaling and its functional role in prematurity. In that study, we identified the need to establish and optimize a standard isolation protocol for human milk extracellular vesicles (mEVs).

Methods: Four mEVs isolation methods were compared: ultracentrifugation (UC), size exclusion chromatography (SEC), immunoprecipitation with tetraspanin CD9 (IP_CD9) and ExoGAG. Three pools of human milk (each composed of samples from ten donor mothers) were used and isolation of mEVs was performed starting from the same volume for each method. The proteomic, transcriptomic and glycomic composition of the extracellular vesicles obtained after isolation was then analyzed for each method. The sensitivity, specificity and quality of the results were also determined. A comparative analysis of results common across all isolation methods was performed to identify potential signaling pathways associated with mEVs.

Results: ExoGAG and UC proved to be the most efficient of the four techniques compared for mEVs isolation. However, ExoGAG compared to UC provided a higher concentration of total and vesicle-related proteins and peptides and a higher glycoprotein count keeping all the glycan subgroups. Despite ExoGAG and UC show similar vesicle profiles in terms of size, concentration, tetraspanin subpopulations and EVs markers, ExoGAG was the most efficient technique in terms of accuracy, consistency and reproducibility for omics studies. Furthermore, results allowed us to identify that mEVs components are involved in the signaling pathways of infant biological development, immune system maturation and protein metabolism.

Conclusions: This study establishes UC and ExoGAG as reliable methods for mEVs isolation and describes its protocol, being ExoGAG the most efficient. Also, the omics analysis show that biomolecules conforming those mEVs are linked to the defense system against external agents (specific role in the immune system pathway) and in the correct establishment of the neural structure (developmental pathway), while providing all the nutritional requirements for the correct growth of the newborn (metabolic pathway).

Graphical Abstract:

Supplementary Information: The online version contains supplementary material available at 10.1186/s12964-025-02390-x.

Keywords: Extracellular vesicles; Glycomics; Human milk; Isolation method; Proteomics; Transcriptomics.


Conflict of interest statement

Declarations. Ethics approval and informed consent to participate: The participating mothers gave their written informed consent to participate in this study. Ethics committee approval was obtained from Research Ethics Committees of Galicia (register code: 2020/243). Competing interests: Only Miguel A. Garcia Gonzalez reports conflict of interest as is included as author in the patent of the isolation method KITGAG (Commercialized as ExoGAG).

Figures
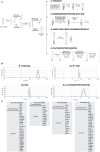
Fig. 1
Fig. 1
Scheme of milk extracellular vesicles isolation techniques and brief characterization. (A) Milk EVs isolation by A.1) Ultracentrifugation A.2) Immunoprecipitation with CD9, A.3) Size Exclusion Chromatography and A.4) ExoGAG. (B) Size and distribution profiles of B.1) UC, B.2) IP_CD9, B.3) SEC and B.4) ExoGAG mEVs with Zetasizer. (C) EVs markers according to MISEV 2023 found in every technique DDA mass spectrometry data. Prior to extracellular vesicle isolation, milk samples were organized in three pools (POOL1, POOL2 and POOL3) and went through an initial defatting step with two serial centrifugations. Then, every pool went through an isolation process with Ultracentrifugation, Immunoprecipitation, Size Exclusion Chromatography and ExoGAG. A brief characterization was developed to determine size, distribution and EVs marker composition of each method
Fig. 2
Fig. 2
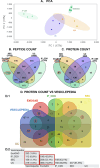
DDA-MS recovery analysis. (A) PCA analysis of DDA-MS data from mEVs isolated by the four methods. (B) Venn Diagram of peptide recovery between methods. (C) Venn Diagram of protein recovery between methods. (D) Total protein count in comparison to Vesiclepedia database. (D.1) Venn Diagram and (D.2) correlation matrix. Samples are properly clustered in the PCA analysis, which explains more than 75% of the differences between groups with only the first two components (PC1 and PC2). Total peptide and protein count show protein abundance and similarities found between groups. ExoGAG stands out in both cases, also reaching statistical significance in comparison to IP_CD9. Despite not finding significant differences with the other techniques, we can see a tendence where UC and SEC have less power recovery than ExoGAG. Again, in comparison to Vesiclepedia database the greater yield corresponds to ExoGAG
Fig. 3
Fig. 3
Tables of TOP15 protein spectral counts detected in each isolation technique. Proteins found in ExoGAG TOP 15 are coincident to most enriched proteins in the rest of the methods, meaning that includes almost the same recovery as the other three techniques all together. Data are ordered from higher to lower spectral counts according to the color code described. Proteins found in more than one method are highlighted in dark red. The abundance of the protein in the technique is compared to its abundance in the rest of the methods in the right column of each table. ↑ means upregulated. ↓ means downregulated. None means the protein abundance is included in the same group. Colors correspond to: dark blue > 4000 counts, light blue 4000 − 2000, light pink 2000 − 1000, violet 1000 − 500, dark violet 500 − 250, pink 250-1, white 0
Fig. 4
Fig. 4
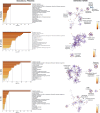
Functional analysis of biological processes and enriched terms of DDA-MS data with Metascape tool. Both biological processes and enriched terms of proteins found in DDA-MS analysis after isolation with (A) ExoGAG, (B) IP_CD9, (C) SEC and (D) UC were described. All methods showed coincidental biological processes although specific terms were more variable
Fig. 5
Fig. 5
Interactions between proteins found in the SWATH-MS analysis after isolation with the four methods. Comparisons between proteins yielded in (A) ExoGAG vs. IP_CD9, (B) ExoGAG vs. SEC and (C) ExoGAG vs. UC were performed. The main part of the clusters are only represented in each one of the comparisons, except for the ribosomal cluster in light green and cytoplasmatic proteins in dark red
Fig. 6
Fig. 6
Functional analysis of DEPs detected by SWATH-MS after the EVs isolation techniques analyzed with Reactome. Analysis of DEPs revealed that (A) immune system, (B) protein metabolism, (C) developmental biology, and (D) metabolism are central processes to which human milk may be contributing during infant growth. Among these identified biological processes the immune system is mainly represented by the innate immune system being neutrophil degranulation, the complement cascade and the antimicrobial effect detected with lower FDRs than the rest of the paths. Metabolism of proteins seems to be highly affected by post-translational modifications, outstanding phosphorylation among the others. Similarly, the nervous system appears as central in developmental biology processes, with a key role in axon guidance. Finally, metabolism of amino acids and derivates stands out from the pathways includes in metabolism, gaining higher importance the metabolism of selenoamino acids. FDR was calculated as the average of FDRs for each pool of milk for the exact same process for its up and down regulated proteins in ExoGAG vs. the other three techniques individually. Red circles belong to upregulation; green circles belong to downregulation
Fig. 7
Fig. 7
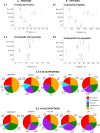
Glycomic analysis of the vesicle-related fraction of raw milk and after isolation with ExoGAG, IP_CD9, SEC and UC. (A) Protein and (B) peptide recovery before and after the isolation with the four methods. We first selected only vesicle-related (A.1) proteins and (B.1) peptides and then compared only the glycated fraction of both (A.2) proteins and (B.2) peptides. Sectors diagram of (A.3) glycoproteins and (B.3) glycopeptides detected by each technique. Bars represent means ± SEM. Kruskal-Wallis omnibus test and pairwise Dunn’s post-hoc tests applying Benjamini-Hochberg correction was used. p < 0.05 was considered significant. Only significative comparisons are shown: * p < 0.05
Fig. 8
Fig. 8
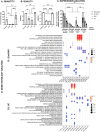
RNA extraction, miRNA expression and Gene Ontology (GO) analysis of mEVs isolated by ExoGAG, IP-CD9, SEC and UC. (A) Quantity of miRNAs detected after milk EVs isolation by the four techniques. The quality of the miRNAs obtained was determined by measurements in Agilent 2100 Bioanalyzer considering (B) A260/280 ratio and A260/230 ratio. (C) Expression levels detected after performing nCounter® Human v3 miRNA Assay CSO Panel Assay to mVEs isolated by ExoGAG, IP_CD9, SEC and UC. (D) Bubble plot showing the statistically significant terms from GO database, grouped by miRNAs > 100 counts common for pools isolated with the same method. Concentration and quality criteria were met after ExoGAG and UC isolation with high levels of statistical significance. miRNA expression was significantly enhanced with ExoGAG and UC compared to the other techniques, although the first presented higher values and less dispersion in every category. It should be noted that the number of miRNAs detected > 100 counts, representing the detection of the highest expressed miRNAs, constitutes the most robust and valuable result. The average detection in this category was 72 and 43 counts in ExoGAG and UC respectively. Furthermore, GO analysis showed a good recovery for UC and ExoGAG, improving the detection with the last. One of the samples from the SEC and IP_CD9 groups had to be removed due to poor quality derived from the extraction. RNA extraction was developed twice to avoid technical bias. Values close to 2.0 means RNA purity for A260/280. Values between 1.8 and 2.2 means RNA purity for A260/230 ratio. The size of each point in bubble plots is proportional to the gene ratio, defined as the number of genes in the input list annotated to the corresponding term divided by the total number of genes in the input list. The color of the points represents the –log₁₀ adjusted P-value from the enrichment analysis. Two-way ANOVA with multiple comparisons was used and a value of p < 0.05 was considered significant. ns represents not significative, * p < 0.05, ** p < 0.01, *** p < 0.001, **** p < 0.0001
Fig. 9
Fig. 9
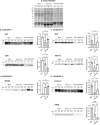
Total protein and vesicle-related markers in raw milk and mEVs isolated by Ultracentrifugation and ExoGAG. (A) Protein fingerprint in raw milk (MILK), extracellular vesicles isolated by Ultracentrifugation (mEVs UC) and extracellular vesicles isolated by ExoGAG (mEVs ExoGAG) stained with Oriole (BioRad®). The protein abundance of the markers under the three conditions was determined by Western Blot. Furthermore, the densitometry analysis was performed for each of them making use of ImageJ. The detected EVs markers included; (B) Category 1: CD9 and CD81, (C) Category 2: ALIX and TSG101, (D) Category 5: MFGE8, (E) Category 3: βcasein and TGFBI. All markers were detected at least twice in independent experiments. P1, P2 and P3 means POOL1, POOL2 and POOL3 respectively. Total protein stain was used as a housekeeping. Ordinary One-way ANOVA with multiple comparisons was used and a value of p < 0.05 was considered significant: ns represents not significative, * p < 0.05, ** p < 0.01
Fig. 10
Fig. 10
Single-vesicle profile of raw milk and mEVs isolated by ExoGAG and Ultracentrifugation by TEM and SP-IRIS. (A) TEM images of mEVs derived from ExoGAG isolation method. We can see two types of EVs, precipitated forming part of the ExoGAG-GAG-Vesicle complex (the dye responsible for the complex would appear as a black background showing a dense image acquisition) or free, whereas UC mEVs only appear individually. (B) Immunofluorescence representative images of each condition showing vesicles captured and stained by CD63, CD81 and CD9. (C) Sectors graph and bar graph showing tetraspanin subpopulation profile (CD63 in red, CD81 in green and CD9 in blue) of raw milk, UC and ExoGAG mEVs. (D) Heatmap and bar graph representing differences between raw milk, ExoGAG and Ultracentrifugation isolation vesicle count. Bars represent means ± SEM. Ordinary One-way ANOVA was used for multiple comparisons and a value of P < 0.05 was considered significant. ns represents not significative, * p < 0.05, ** p < 0.01

References

    1. Basak T, Bhat A, Malakar D, Pillai M, Sengupta S. In-depth comparative proteomic analysis of yeast proteome using iTRAQ and SWATH based MS. Mol Biosyst. 2015;11(8):2135–43. 10.1039/c5mb00234f. - PubMed
    1. Bhattacharya A, Hamilton AM, Furberg H, Pietzak E, Purdue MP, Troester MA, Hoadley KA, Love MI. An approach for normalization and quality control for NanoString RNA expression data. Brief Bioinform. 2021;22(3) bbaa163. 10.1093/bib/bbaa163 - PMC - PubMed
    1. Blans K, Hansen MS, Sørensen Lv, Hvam ML, Howard KA, Möller A, Wiking L, Larsen LB, Rasmussen JT. Pellet-free isolation of human and bovine milk extracellular vesicles by size-exclusion chromatography. J Extracell Vesicles. 2017;6(1) 1294340. 10.1080/20013078.2017.1294340 - PMC - PubMed
    1. Buratta S, Urbanelli L, Tognoloni A, Latella R, Cerrotti G, Emiliani C, Chiaradia E. (2023). Protein and Lipid Content of Milk Extracellular Vesicles: A Comparative Overview. In Life (Vol. 13, Issue 2) Page. 401. MDPI. 10.3390/life13020401 - PMC - PubMed
    1. Buzás EI, Tóth E, Sódar BW, Szabó-Taylor K. Molecular interactions at the surface of extracellular vesicles. In: Seminars in Immunopathology, vol. 40. Springer; 2018. p. 453–64. 10.1007/s00281-018-0682-0. - PMC - PubMed

LinkOut - more resources