. 2025 Oct 2;24(1):239.
doi: 10.1186/s12943-025-02449-w.

BRD9-p53-E2F1 circuit orchestrates cell growth and DNA damage repair in gastric cancer

Affiliations

BRD9-p53-E2F1 circuit orchestrates cell growth and DNA damage repair in gastric cancer

Qingqing Zhou et al. Mol Cancer. .

Abstract

Background: BRD9 is involved in multiple physiological and pathological pathways, yet its functional role and molecular mechanisms in gastric cancer (GC) remain largely unexplored. Addressing this knowledge gap is critical given the persistent global mortality burden of GC and the limited efficacy of current therapeutic strategies.

Methods: BRD9 expression in GC patients was systematically analyzed using immunohistochemical (IHC) assays and transcriptomic datasets. Comprehensive functional validation, employing cellular and murine tumor models, elucidated BRD9's role in GC progression. Molecular pathways underlying BRD9-mediated gastric carcinogenesis were delineated through integrated approaches, including RNA sequencing, co-immunoprecipitation (co-IP), subcellular fractionation, and luciferase reporter assays.

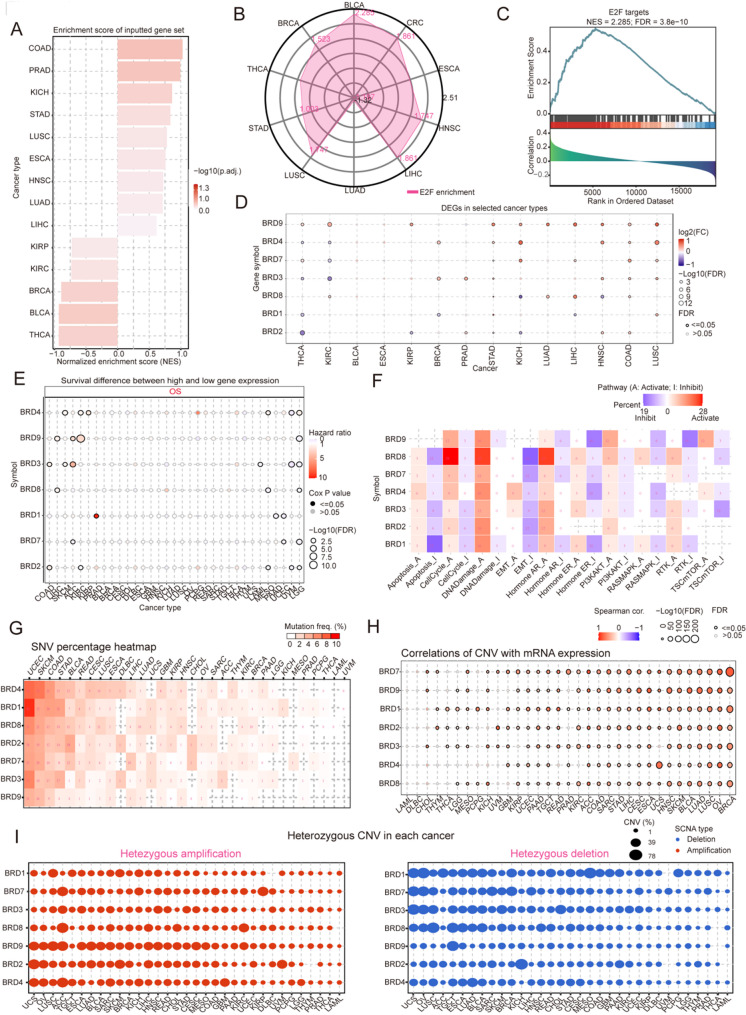
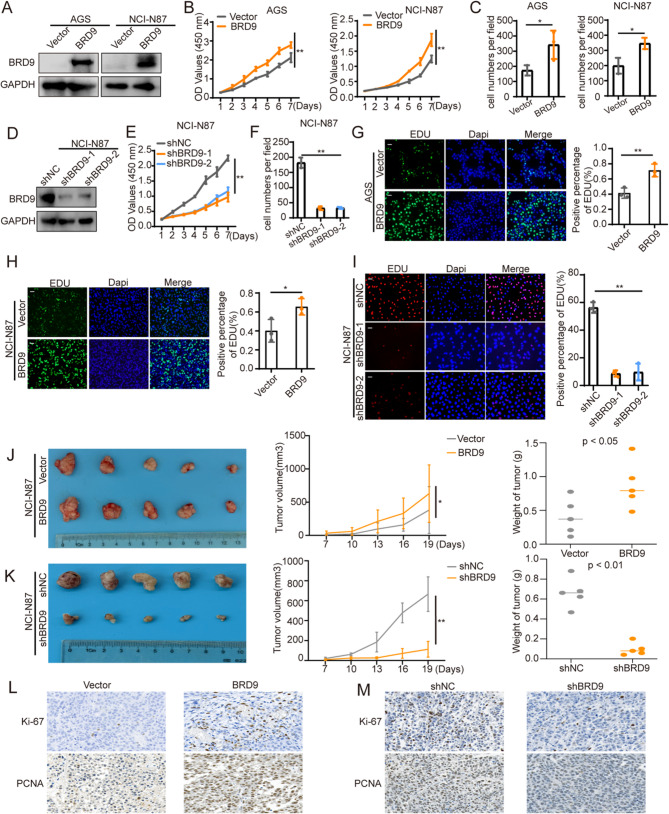
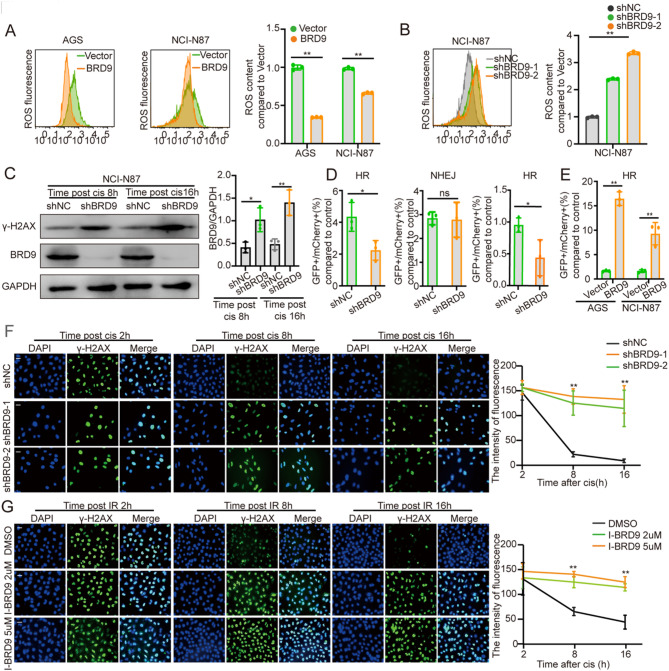
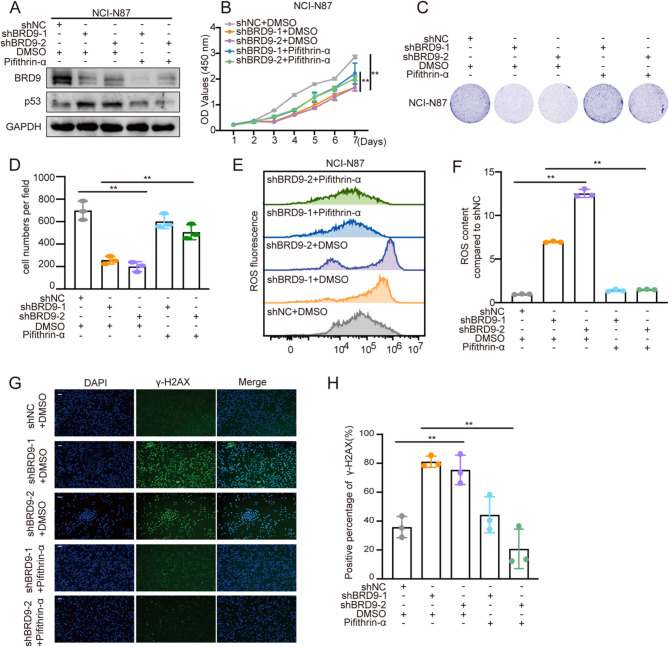
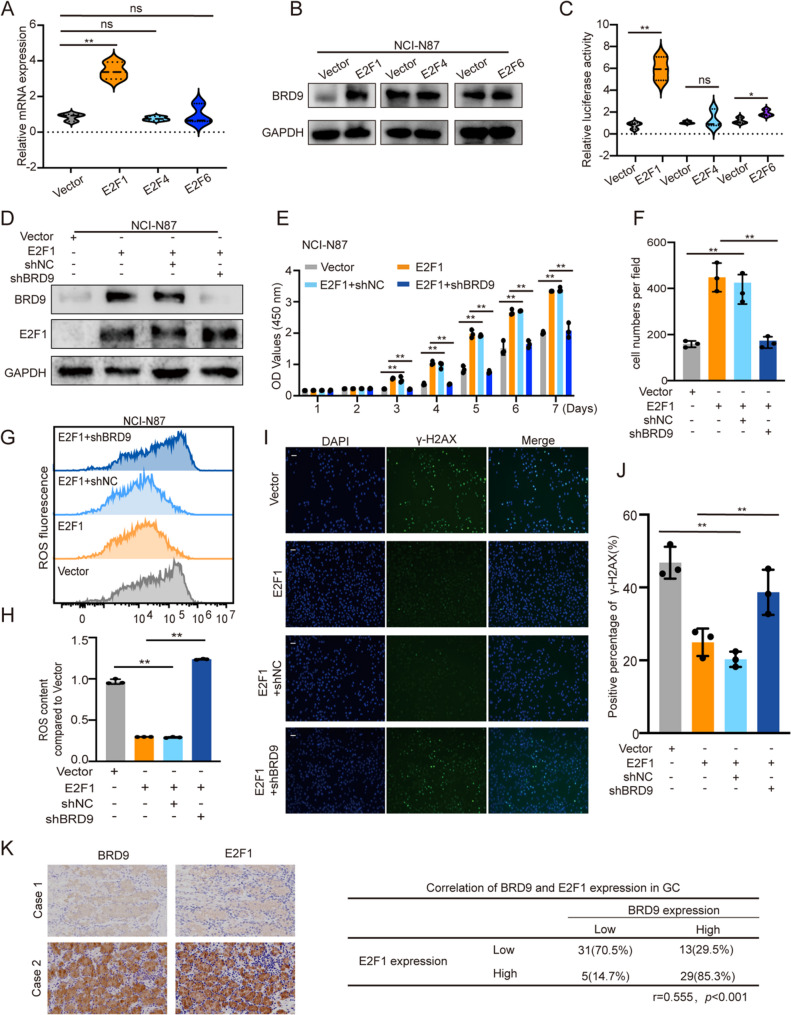
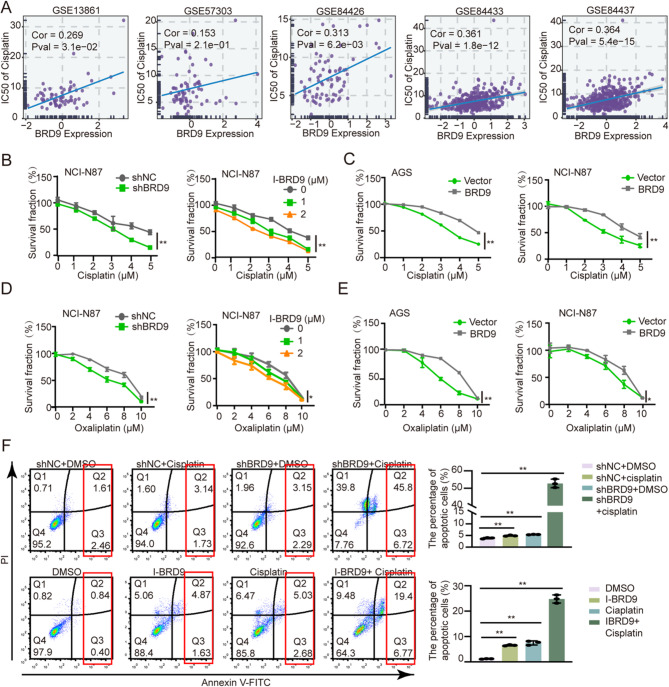
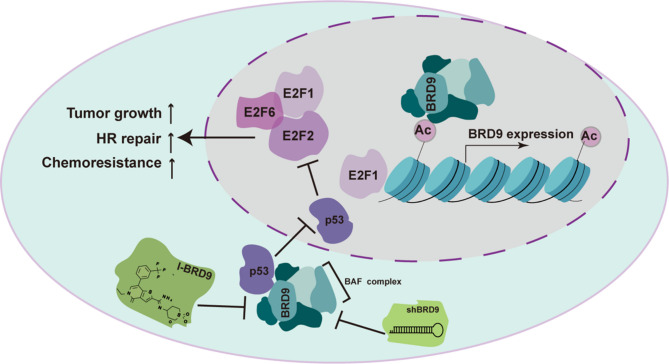
Results: BRD9 was significantly overexpressed in GC and associated with poor patient prognosis. Functionally, BRD9 promoted GC cell proliferation and enhanced DNA damage repair capacity. Mechanistically, elevated BRD9 expression inhibited p53 nuclear translocation via direct binding, subsequently activating the E2F transcription factor family. Notably, we identified that E2F1 directly bound to and transactivated the BRD9 promoter, establishing a positive feedback loop that sustains BRD9 expression. Additionally, BRD9 knockdown sensitized GC cells to cisplatin and oxaliplatin treatment.

Conclusions: These findings highlight the critical role of BRD9 in GC progression and its therapeutic potential. The BRD9-p53-E2F1 axis acts as a crucial regulator of GC cell proliferation and DNA damage response. Targeting BRD9 pharmacologically could be a novel therapeutic approach to enhance chemotherapy efficacy and improve treatment outcomes in GC patients.

Keywords: BRD9; DNA damage repair; E2F family; Gastric cancer; P53; Progression.


Conflict of interest statement

Declarations. Ethics approval and consent to participate: The clinical samples and information used in the study was approved by the Institutional Review Board of Fudan University Shanghai Cancer Center. The animal experiments were conducted in compliance with protocols approved by the Shanghai Medical Experimental Animal Care Commission. Competing interests: The authors declare no competing interests.

Figures

Fig. 1
Fig. 1
Pan-cancer and the BRDs family. A Scores of BRDs family genes among different tumors. B Enrichment scores of E2F-related pathway activities in different tumors. C GSEA indicates that E2F signaling pathway was enriched in different tumors. D Differential expression of BRDs family genes in different tumors. E Survival analysis of BRDs family genes. F Percentage of the impact of BRDs family genes on pathway activities. G Heatmap of the mutation frequencies of BRDs family genes. The numbers indicate the samples with the corresponding mutated genes in a cancer. “0” indicates no mutation in the gene coding region, and a blank indicates no mutation in any region of the gene. The color represents the mutation frequency. H Correlation between CNV and mRNA expression of BRDs family genes. I The heterozygous CNV profile shows the percentage of heterozygous CNVs. In a cancer, only genes with CNV > 5% are shown as a point in the figure
Fig. 2
Fig. 2
BRD9 is a diagnostic marker for gastric cancer. A Violin plot of the expression of the BRDs family in TCGA-STAD. B Bubble plot of the differential expression of BRDs family genes between normal epithelial cells and cancerous epithelial cells analyzed by single-cell data. C-D UMAP dimensionality reduction clustering and gene expression of BRD9. E Relationship between BRD9 and chromatin accessibility in different cells. F-G Dimensionality reduction clustering of spatial transcriptomics and gene expression of BRD9. H Validation of the expression of BRD9 in clinical samples using Western blot. I Validation of the expression of BRD9 in clinicopathological specimens using IHC. J Correlation between the expression of BRD9 and the clinicopathological tissue staging. *p < 0.05, **p < 0.01
Fig. 3
Fig. 3
BRD9 increases GC cell proliferation. A The expression level of BRD9 was detected by Western blot in GC cells with BRD9 overexpression. B-C The effect of BRD9-overexpressing in AGS and NCI-N87 on GC cell proliferation was assessed by the CCK8 assay or the colony formation assay. D The expression level of BRD9 was detected by Western blot in GC cells with BRD9 knockdown. E-F The effect of BRD9 knockdown in NCI-N87 on GC cell proliferation was assessed by the CCK8 assay or the colony formation assay. G-H The effect of BRD9-overexpressing in AGS and NCI-N87 on GC cell proliferation was assessed by the EdU assay. Scale bar, 100 μm. I The effect of BRD9 knockdown in NCI-N87 on GC cell proliferation was assessed by the EdU assay. Scale bar, 100 μm. J-K Subcutaneous tumor formation in nude mice (n = 5/group). NCI-N87 cells with BRD9 overexpression (J) and NCI-N87 cells with BRD9 knockdown (K) were injected into one flank of the mouse. L-M IHC images of Ki67 and PCNA expression in xenograft tumors derived from NCI-N87 cells with BRD9 overexpression and NCI-N87 cells with BRD9 knockdown. *p < 0.05, **p < 0.01
Fig. 4
Fig. 4
BRD9 in regulating DNA damage repair. A-B Flow cytometry was applied to detect ROS fluorescence on GC cells under BRD9 overexpression or knockdown. C Western blot was applied to detect the content of γ-H2AX on BRD9 knockdown GC cells treated with 2 µM cisplatin for 24 h. D Flow cytometry was used to assessed HR- and NHEJ-mediated repair capacity on GC cells under BRD9 knockdown or I-BRD9 treatment. E Flow cytometry was used to assess HR-mediated repair capacity on GC cells under BRD9 overexpression. F-G Immunofluorescence was used to detect the content of γ-H2AX on GC cells under BRD9 knockdown or BRD9 inhibitor (I-BRD9) treatment, treated with 2 µM cisplatin for 24 h. Scale bar, 200 μm.*p < 0.05, **p < 0.01
Fig. 5
Fig. 5
BRD9 inhibits p53 nuclear translocation, thereby activating the E2F signaling pathway. A KEGG pathway analysis shows the significantly affected signaling pathways upon BRD9 overexpression in NCI-N87 cells. B GSEA indicates that E2F signaling pathway was activated upon BRD9 overexpression on GC cells. C The expression of E2F1, E2F2, E2F3, E2F4, E2F5 and E2F6 was assessed by qPCR in BRD9-overexpressing GC cells. D The expression of E2F1, E2F2, E2F3, E2F4, E2F5 and E2F6 was assessed by qPCR in BRD9 knockdown GC cells, treated with p53 inhibitor (Pifithrin-α). E BRD9 overexpression or knockdown cells were transfected with E2F luciferase reporter vectors. The corresponding relative luciferase activities were determined by reporter gene assays. F The expression of E2F1, E2F2, E2F3, E2F4, E2F5, E2F6 and BRD9 was assessed using datasets from TCGA. G Co-IP and Western blot showed that BRD9 and p53 bind to each other. H Under conditions of BRD9 inhibition (I-BRD9), the interaction between p53-BRD9 was evaluated. I Immunofluorescence assays detected the protein expression levels of p53 and BRD9 in NCI-N87 cells. Scale bar, 5 μm. J-K The levels of p53 in cytoplasm, mitochondria, nucleus and the total were determined by Western blot on GC cells under BRD9 overexpression or knockdown. L IHC images of p53 expression in xenograft tumors derived from NCI-N87 cells with BRD9 overexpression. M BRD9 knockdown cells were transfected with E2F luciferase reporter vectors, with or without Pifithrin-α treatment. The corresponding relative luciferase activities were determined by reporter gene assays. *p < 0.05, **p < 0.01
Fig. 6
Fig. 6
BRD9 drives GC progression through the p53-E2F pathway. A The expression of BRD9 and p53 was assessed by Western blot in BRD9 knockdown GC cells, treated with Pifithrin-α. B CCK8 assay was used to evaluate cell proliferation in BRD9 knockdown GC cells, treated with Pifithrin-α. C-D Colony formation assay was used to evaluate cell proliferation in BRD9 knockdown GC cells, treated with Pifithrin-α. E-F Flow cytometry was applied to detect ROS fluorescence in BRD9 knockdown GC cells, treated with Pifithrin-α. G-H Immunofluorescence was used to detect the content of γ-H2AX in BRD9 knockdown GC cells, treated with Pifithrin-α. Scale bar, 50 μm.*p < 0.05, **p < 0.01
Fig. 7
Fig. 7
E2F1 directly binds to the BRD9 promoter and induces BRD9 expression in GC cells. A The expression of BRD9 mRNA was assessed by qRT-PCR in GC cells transfected with E2F1, E2F4, E2F6 or vector. B The expression of BRD9 was assessed by Western blot in GC cells transfected with E2F1, E2F4 or E2F6. C NCI-N87 was transfected with BRD9 luciferase reporter vectors and E2F1, E2F4, E2F6 or vector. The relative luciferase activities were determined by reporter gene assays. D Western blot analysis detected the expression of E2F1 and BRD9 in E2F1 overexpressing cells treated with BRD9 shRNA. E-F CCK8 assay and colony formation assay were used to evaluate cell proliferation in E2F1 overexpressing cells treated with BRD9 shRNA. G-H Flow cytometry was applied to detect ROS fluorescence in E2F1 overexpressing cells treated with BRD9 shRNA. I-J Immunofluorescence was used to detect the content of γ-H2AX in E2F1 overexpressing cells treated with BRD9 shRNA. Scale bar, 50 μm. K BRD9 and E2F1 expression correlation in GC tissues was analyzed by IHC. *p < 0.05, **p < 0.01
Fig. 8
Fig. 8
Depletion of BRD9 potentiates the cytotoxic effects of cisplatin and oxaliplatin in GC cells. A Analysis of GC databases reveals a positive correlation between cisplatin IC50 and BRD9 expression. B The 24-hour survival fraction was analyzed in NCI-N87 cells following BRD9 knockdown or I-BRD9 treatment with cisplatin (1–5 µM). C The 24-hour survival fraction was analyzed in AGS and NCI-N87 cells following BRD9 overexpression treated with cisplatin (1–5 µM). D The 24-hour survival fraction was analyzed in NCI-N87 cells following BRD9 knockdown or I-BRD9 treatment treated with oxaliplatin (2–10 µM). E The 24-hour oxaliplatin survival fraction was analyzed in AGS and NCI-N87 cells following BRD9 overexpression treated with oxaliplatin (2–10 µM). F NCI-N87 treated with BRD9 shRNA or I-BRD were treated with cisplatin (2 µM) for 24 h, and apoptotic cells were assessed by flow cytometry. *p < 0.05, **p < 0.01
Fig. 9
Fig. 9
Schematic representation of the BRD9-p53-E2F1 Signaling Nexus Integrates Growth Control and Genomic Stability Maintenance in GC

References

    1. Siegel RL, Giaquinto AN, Jemal A. Cancer statistics, 2024. CA Cancer J Clin. 2024;74:12–49. - PubMed
    1. Smyth EC, Nilsson M, Grabsch HI, van Grieken NC, Lordick F. Gastric cancer. Lancet. 2020;396:635–48. - PubMed
    1. López MJ, Carbajal J, Alfaro AL, Saravia LG, Zanabria D, Araujo JM, et al. Characteristics of gastric cancer around the world. Crit Rev Oncol Hematol. 2023;181:103841. - PubMed
    1. Alsina M, Arrazubi V, Diez M, Tabernero J. Current developments in gastric cancer: from molecular profiling to treatment strategy. Nat Rev Gastroenterol Hepatol. 2023;20:155–70. - PubMed
    1. Yang L, Ying X, Liu S, Lyu G, Xu Z, Zhang X, et al. Gastric cancer: epidemiology, risk factors and prevention strategies. Chin J Cancer Res. 2020;32:695–704. - PMC - PubMed

MeSH terms