. 2025 Oct 2;17(1):109.
doi: 10.1186/s13073-025-01541-6.

Identification of a PRDM1-regulated T cell network to regulate atherosclerotic plaque inflammation

Affiliations

Identification of a PRDM1-regulated T cell network to regulate atherosclerotic plaque inflammation

Han Jin et al. Genome Med. .

Abstract

Background: Inflammation is a key driver of atherosclerosis, yet the mechanisms sustaining inflammation in human plaques remain poorly understood. This study uses a network-based approach to identify immune gene programs involved in the transition from low- to high-risk (rupture-prone) human atherosclerotic plaques.

Methods: Expression data from human carotid artery plaques, both stable (low-risk, n = 16) and unstable (high-risk, n = 27), were analyzed using Weighted Gene Co-expression Network Analysis (WGCNA). Bayesian network inference, operated on the eigengene values from the WGCNA, further extended the WGCNA analysis, and similarity to the signature of T cell subsets was validated in single-cell RNA sequencing data of human plaques, and a loss-of-function study in a mouse model of atherosclerosis. In silico drug repurposing was performed to identify potential therapeutic targets.

Results: Our analysis revealed a distinct gene module with a prominent T cell signature, particularly in unstable plaques. Key regulatory factors, RUNX3, IRF7 and in particular PRDM1, were significantly downregulated in plaque T cells from symptomatic versus asymptomatic patients, indicating a protective role. Additionally, as PRDM1 is downstream of IRF7, we opted for PRDM1 as a key target. T cell-specific Prdm1 deficiency in Western-type diet fed Ldlr knockout mice featured accelerated plaque progression. Finally, as PRDM1 targeting drugs are not yet available, we performed in silico drug repurposing, identifying EGFR inhibitors as promising therapeutic candidates.

Conclusions: This study highlights a PRDM1-regulated T cell network that distinguishes high-risk from low-risk plaques and demonstrates the regulatory role of T cell PRDM1 in controlling atherosclerosis, positioning this pathway as a promising therapeutic target.

Keywords: Atherosclerosis; Carotid endarterectomy; Microarray; PRDM1; Single-cell sequencing; T cell.


Conflict of interest statement

Declarations. Ethics approval and consent to participate: All patient materials collected for the MaasHPS dataset (GSE163154) [18] were obtained in accordance with the Dutch Code for Proper Secondary Use of Human Tissue ( https://www.federa.org ) and with approval from the local Medical Ethical Committee (protocol number 16-4-181). This study conforms to the principles of the Declaration of Helsinki, and all participants provided written informed consent prior to inclusion. All BiKE human samples (GSE21545) [21] were collected with informed consent from patients or guardians of organ donors. BiKE studies were approved by the Karolinska Institute ethics committee (file numbers 02-147 and 2009/295-31/2) and were conducted in accordance with the Declaration of Helsinki. Due to GDPR and ethical regulations protecting participant privacy, individual-level human data cannot be deposited or shared. Three patients with severe carotid plaque requiring carotid endarterectomy were identified and consented in collaboration with the Scripps Health Biorepository, under IRB# 19-7332 approved by the Scripps Institutional Review Board. Informed consent was obtained for all collected samples, which were used for the scRNA-seq dataset (GSE159677) [23]. Patients undergoing carotid endarterectomy at Mount Sinai Hospital were enrolled in an ongoing clinical study approved by the Institutional Review Board of the Icahn School of Medicine at Mount Sinai, under IRB# 11–01427. Written informed consent was obtained from all eligible participants. Exclusion criteria included current infection, autoimmune disease, active or recurrent cancer, severe renal failure requiring dialysis, or peripheral arterial occlusive disease causing pain at rest. Samples were collected from each patient and used to generate the scRNA-seq dataset (GSE224273) [25]. All mouse experiments were approved by the regulatory authority of the Maastricht University Medical Centre (permit number: 2018-011-008) and local German regulatory authorities (Landesamt für Natur, Umwelt und Verbraucherschutz Nordrhein-Westfalen, Germany, approval number 81-02.04.2019.A363). The experiments complied with the Dutch governmental guidelines and Directive 2010/63/EU of the European Parliament on the protection of animals used for scientific purposes and the German animal protection law. Furthermore, the study was conducted in compliance with the ARRIVE guidelines. Every effort was made to minimize suffering. Consent for publication: Not applicable. Competing interests: The authors declare no competing interests.

Figures

Fig. 1
Fig. 1
Schematic workflow. The carotid artery specimen were sliced into 5 mm thick parallel sections, snap-frozen in liquid nitrogen, and stored for future use. Every second section was used for histology, stained with Hematoxylin and Eosin, and classified based on the absence/presence of IPH and classification criteria adapted from the American Heart Association (AHA) scheme [26] to determine progression stage. This classification yielded 16 stable (low-risk) and 27 unstable (high-risk) plaque segments, which were subsequently used for microarray analysis. WGCNA was conducted on the microarray gene expression data from the carotid endarterectomy plaques. Co-expression clusters were identified through network-based hierarchical clustering, and disease-associated clusters were pinpointed by integrating WGCNA results with plaque traits from IHC. These selected clusters were then further examined through gene set enrichment, overrepresentation, correlation, and regulatory network analysis. One key regulator identified in the regulatory network analysis, PRDM1, was investigated in an atherosclerotic mouse model, specifically examining the effect of T cell-specific Prdm1 deficiency on atherosclerosis development. AHA - American Heart Association, IHC - Immunohistochemistry, PRDM1 - PR Domain Zinc Finger Protein 1, WGCNA - Weighted Gene Co-expression Network Analysis
Fig. 2
Fig. 2
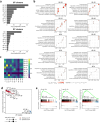
WGCNA of unstable and stable plaques identifies key gene co-expression clusters. a Bar plots display the top 10 co-expression clusters ranked by clustering enrichment scores derived from GSOA of WGCNA clusters based on unstable plaques (UP) or stable plaques (SP). b Dot plots illustrate the significance levels of the top-ranked overrepresented GO terms for each of the top 10 UP co-expression clusters. c GO-based semantic similarity between the top-10 UP clusters and the top-10 SP clusters in a. d Dotplot summarizes the GSEA results of UP clusters. Significantly enriched clusters (adjusted p-value < 0.05) are labeled. e GSEA results for the three significant UP clusters (UP-11, UP-22, and UP-32) are presented. Adj – adjusted, IFN – interferon, IPH – intraplaque hemorrhage, GO - Gene Ontology, GSEA - Gene Set Enrichment Analysis, GSOA - Gene Set Overlap Analysis , SP – stable plaque, UP – unstable plaque, WGCNA - Weighted Gene Co-expression Network Analysis
Fig. 3
Fig. 3
Analyses of the unstable plaque WGCNA co-expression network. a Visualization of the unstable plaque co-expression network, where genes are color-coded according to their WGCNA cluster. Edge weights, derived from the unstable plaque WGCNA adjacency matrix, highlight connection between genes, with only edges exceeding a weight of 0.3 displayed. This results in a network representation of 5370 out of 12,341 genes. b t-SNE plots of the genes from Fig 3a based on their expression profiles in unstable plaques. The left panel shows clusters colored according to the 38 unstable plaque WGCNA clusters, while the right panel focuses on three principal clusters (UP-11, n = 62; UP-22, n = 45; UP-32, n = 111). c Bar plot depicting the relative average adjacency of the UP-11 cluster, UP-22 cluster, and remaining clusters (“rest”) to the T cell-specific cluster (UP-32) based on the WGCNA adjacency matrix of the unstable plaque network. The average adjacency between UP-32 and all other clusters was normalized to 1 and used as the reference. d Directed Bayesian network illustrating the relationships among the 15 most biologically meaningful UP WGCNA clusters (CES > 3). e Heatmap showing correlations and significance levels between eigengenes of the three unstable plaque co-expression clusters and plaque traits assessed by IHC. Adj – Adjusted, Arg – Arginine, ECM – Extracellular matrix, ERAD – Endoplasmic reticulum–associated protein degradation, IFN – Interferon, IHC - Immunohistochemistry, (iNOS – Nitric oxide synthases, mRNA – messenger ribonucleic acid, ncRNA – non-coding ribonucleic acid, NES – normalized enrichment score, SMA – Smooth muscle actin, SMC – Smooth muscle cells, SP – stable plaque, t-SNE – t-distributed stochastic neighbor embedding, UP – unstable plaque, WGCNA - Weighted Gene Co-expression Network Analysis
Fig. 4
Fig. 4
UP-32 gene co-expression cluster is enriched in plaque T cells (GSE159677). a UMAP plot shows cells from the carotid atherosclerotic core and patient-matched proximal adjacent tissues (both n = 3) in GSE159677 dataset. b Dot plot shows the markers of each cell type in a. c UMAP plot shows the enrichment of the UP-32 T cell-specific cluster (UP-32; n = 250) in cells from GSE159677. d UMAP plot shows the subtypes of plaque T cells in GSE159677. e Violin plot shows the enrichment of the UP-32 T cell-specific cluster in plaque cells from GSE159677 dataset. Mono – monocyte, Macro – macrophage, DC – dendritic cell, EC – endothelial cell, NK – natural killer, SMC – smooth muscle cell, Tnaive – naïve T cell, Tmem – memory T cell, Tem – effector memory T cell, Trm – resident memory T cell, CTL – cytotoxic T cell, Treg – regulatory T cell, Th17 – T helper 17 cell
Fig. 5
Fig. 5
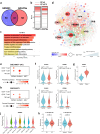
Regulatory network reconstruction for UP-32 T cell-specific cluster. a Venn diagram illustrating the overlap among the top 100 ranked TFs identified by GENIE3 and ARACNe algorithms. b Ranking positions of the 32 overlapping TFs in Fig 5a in the top 100 TFs lists of GENIE3 and ARACNe. TFs that intersect with iRegulon results are marked with red lines (9 TFs, G⋂A⋂I), while those exclusive to GENIE3 or ARACNe are marked with gray lines (23 TFs, G⋂A). ⋂ – intersection symbol. c Bar plot showing the GSOA results for the nine TFs identified in Fig 5b. The top nine representative significant GO terms are shown. d Regulatory network visualization of genes in T cell-specific cluster (UP-32; n = 195 of 250 genes) predicted to be regulated by the nine TFs from Fig 5b as determined by iRegulon. Each TF-target network is color-coded, with gene color representing log2 fold change (log2FC; unstable vs. stable plaques) of gene expression in unstable compared to stable plaques and edge transparency reflecting GENIE3 weight. TFs are presented by large circles, and target genes by small globes. e Dot plots show the expression level of PRDM1, RUNX3, and IRF7 in CD4+, CD8+ T cells, and NK cells in atherosclerotic core tissues (AC) from GSE159677 dataset. f Violin plots show the expression of PRDM1 and RUNX3 between proximally adjacent (PA) and atherosclerotic core (AC) tissues based on GSE159677 dataset. g Violin plots show the expression of PRDM1 in carotid plaques from n = 127 patients and n = 10 control/healthy arteries. h Dot plots show the expression level of PRDM1, RUNX3, and IRF7 in CD4+, CD8+ T cells, and NK cells in carotid plaques from GSE224273 dataset. i Violin plots show the expression of PRDM1 and RUNX3 between asymptomatic and symptomatic patients based on GSE224273 dataset. j Violin plot shows the expression of PRDM1 across T cell subsets based on GSE159677. k Violin plots show the enrichment of the UP-32 T cell cluster in plaque T cells from GSE159677 (left) and GSE224273 (right) dataset, with median level indicated per group. P-values were calculated based on the Wilcoxon rank-sum test, with Benjamini-Hochberg correction for multiple testing. AC – atherosclerotic core, GO – gene ontology, GSOA – Gene Set Ontology Analysis, PA – proximal adjacent, TFs – transcription factors
Fig. 6
Fig. 6
T cell-specific Prdm1 deficiency increases lesion development. a–c Representative pictures of H&E staining the aortic root (a; Scale bar = 500 µm) and quantification of lesion area in aortic roots (b) and arches (c) of Prdm1+/+Ldlr–/– and Prdm1−/−Ldlr–/– mice following 12 weeks on a Western-type diet (WTD). d Classification of plaque stage as early progressive (pathologic intimal thickening, PIT), advanced with a thick fibrotic cap (TkF), or advanced with a thin fibrotic cap (TnF). e Quantification of macrophage in aortic root lesions, assessed by Mac2 immunofluorescent staining. f–h Representative pictures of Trichrome staining of the aortic roots (f; scale bar = 250 µm). Quantification of necrotic core area (anucleated area) (g) and collagen content (h) in aortic root lesions. i–m Representative flow cytometry dot plots (i, j) and quantification of CD8+ (k) and CD4+ (l) T cells (pre-gated: CD45+CD115Gr1B220) and CD4+CD25+ cells (m) in blood. Data are presented as mean ± SEM; n = 6–7. Statistical significance was assessed by Student t test with Welch correction, Mann–Whitney test, or chi-square, as appropriate. *P < 0.05; **P < 0.01

References

    1. Libby P, Ridker PM, Hansson GK. Progress and challenges in translating the biology of atherosclerosis. Nature. 2011;473(7347):317–25. - PubMed
    1. Shah PK. Mechanisms of plaque vulnerability and rupture. J Am Coll Cardiol. 2003;41(4, Supplement):S15-22.
    1. Bentzon JF, Otsuka F, Virmani R, Falk E. Mechanisms of plaque formation and rupture. Circ Res. 2014;114(12):1852–66. - PubMed
    1. Tabas I, Lichtman AH. Monocyte-macrophages and T cells in atherosclerosis. Immunity. 2017;47(4):621–34. - PMC - PubMed
    1. Ridker PM, Everett BM, Thuren T, MacFadyen JG, Chang WH, Ballantyne C, et al. Antiinflammatory therapy with canakinumab for atherosclerotic disease. N Engl J Med. 2017;377(12):1119–31. - PubMed

MeSH terms

Substances

LinkOut - more resources