. 2025 Oct;14(10):e70168.
doi: 10.1002/jev2.70168.

Heterogeneity of Extracellular Vesicles and Non-Vesicular Nanoparticles in Glioblastoma

Affiliations

Heterogeneity of Extracellular Vesicles and Non-Vesicular Nanoparticles in Glioblastoma

Tuoye Xu et al. J Extracell Vesicles. 2025 Oct.

Abstract

It is increasingly clear that intercellular communication is largely mediated by lipid-bilayer, membrane-bound extracellular vesicles (EVs) and amembranous, non-vesicular extracellular particles (NVEPs), including exomeres and the recently identified supermeres. To elucidate the cargo and functional roles of these carriers, we performed a comprehensive analysis of their lipid, protein and RNA content in the context of colorectal cancer and glioblastoma (GBM). Our results demonstrate that EVs exhibit distinct density profiles correlated with specific biomolecular signatures. Moreover, EVs and NVEPs display notable differences in their protein and RNA composition, which confer distinct functional attributes. Supermeres are notably enriched in components involved in extracellular matrix remodeling and possess the ability to cross the blood-brain barrier, a process dependent on their intact structure and RNA content. Once in the central nervous system (CNS), they preferentially engage with microglia and suppress TGFβ1 expression, suggesting a role in modulating microglial immune activity. Furthermore, systemically administered exogenous supermeres selectively accumulate in GBM tumors in vivo. Together, these findings highlight supermeres as a promising vehicle for delivering therapeutics to the CNS and brain tumors.

Keywords: EGFR; exomeres; extracellular nanoparticles; extracellular vesicles; glioblastoma; supermeres.


Conflict of interest statement

The authors declare no competing interests.

Figures

FIGURE 1
FIGURE 1
Differential ultracentrifugation sediments EVs of similar diameter. (A) Representative NTA (Nanosight) trace plot of conditioned media from the indicated GBM PDX cell cultures. Inset; rate of EV production as determined by concentration of particles per mL normalized to number of cells. Data are presented as the mean ± SEM of biologically independent replicates (GBM6 n = 6 in technical n = 4, GBM39 and GBM59 n = 3 in technical n = 5), unpaired t test, two‐tailed, **** p < 0.0001. ( B) Graphical representation of the differential UC approach and representative western blot of the indicated EV markers. ( C) Representative NTA (Nanosight) trace plot of EVs isolated using differential UC (15k × g and 167k × g) for the indicated GBM PDX cell cultures. ( D) Representative photomicrographs of TEM and quantitation of EV sizes (binned in 10 nm increments) from differential UC (15k × g and 167k × g) of the indicated GBM PDX cell cultures. ( E) Representative flow cytometry plot and quantitation of vesicle size from differential UC (15k × g and 167k × g) isolated EVs from GBM‐6 PDX cell culture. Bead marker sizes are indicated in nm. Data are presented as the mean ± SD of biologically independent replicates, n = 3, unpaired t test, two‐tailed, **p < 0.01. ( F) Dynamic light scattering (DLS) profiles of 15k × g and 167k × g EV preparations of the indicated human GBM PDX cultures. ( G) Nanoflow vesicle flow cytometry applied on CM‐isolated 15k × g and 167k × g preparations. Data are presented as the mean ± SEM of biologically independent replicates, unpaired t test, two‐tailed, **p < 0.01, **** p < 0.0001. ( H) Protein amounts normalized to vesicle numbers. Data are presented as the mean ± SEM of biologically independent replicates (n = 4), unpaired t test, two‐tailed, ***p < 0.001, **** p < 0.0001.
FIGURE 2
FIGURE 2
Differential UC EVs have distinct lipid compositions. (A) Total lipid counts of the 15k × g and 167k × g EV fractions isolated from GBM39. (B–D) Relative lipid subclasses composition (percentage) for ceramides (B), glycerolipids (C), and phospholipids (D). Data are presented as the mean ± SEM of biologically independent replicates (n = 4), unpaired t test, two‐tailed, *p < 0.05, **p < 0.01, ***p < 0.001 and ****p < 0.0001. (E) Volcano plots of total lipids from 15k × g and 167k × g EVs. (F) Heat map of top ranked lipids of each indicated fractions. (G) Venn diagram of enriched (Log2FC > 1) 15k × g and 167k × g EV lipids when compared to cellular levels. Indicated are the top (highest Log2FC down) 12 lipids for each segment.
FIGURE 3
FIGURE 3
Proteomes of 15k and 167k EVs have unique compositions. (A) Volcano plots of proteins from GBM6 15k and 167k EV fractions versus cells. EGFR, CD9, CD63, and CD81 markers are highlighted. (B) Graphical representation of quantitation of vesicle nano‐flow cytometry of the indicated markers in cells, 15k and 167k EV fractions. Data are presented as the mean±SEM of biologically independent replicates (n = 3), unpaired t test, two‐tailed, **p < 0.01, ***p < 0.001 and ****p < 0.0001. (C) Single‐molecule vesicle flow cytometry for the indicated markers in 15k and 167k EVs isolated from GBM6, GBM39 and GBM59. Data are presented as the mean ± SEM of biologically independent replicates (n = 3), unpaired t test, two‐tailed, *p < 0.05, **p < 0.01, and ***p < 0.001. (D) Percentage of indicated GBM PDX cell‐derived 167k EV double positive for EGFR and the indicated tetraspanin markers among the entire population of EGFR‐positive EVs for the three GBM samples. (E) Venn diagram of percentages of GBM59‐derived 167k EVs positive for the indicated markers using digital flow cytometry. (F) Deconvolution of the signal intensity distributions for each indicated antibody marker representing copy number from digital flow cytometry from 167k EVs isolated from GBM59 PDX cells. (G) Venn diagram of protein species preferentially present (Log2FC >1) in GBM 15k and 167k EVs versus cells. Proteins that are common to all three GBM 15k and 167k EVs are indicated. (H) Volcano plots of proteins from DiFi cells 15k and 167k EV fractions versus cells. EGFR, CD9, CD63 and CD81 markers are highlighted. (I) Western blot of proteins isolated from 15k and 167k EV fractions and cells from GBM6, GBM39, GBM59 and DiFi cells for the indicated markers. (J) Heat map of Log2FC of proteins in 15k and 167k EV versus cells from DiFi, GBM6, GBM39 and GBM59 cells. Data are from biologically independent replicates (DiFi n = 4, GBMs n = 3). (K) Venn diagram of protein species preferentially present (Log2FC > 1) in DiFi and GBM 15k and 167k EVs versus cells. Proteins that are common to all four categories are indicated.
FIGURE 4
FIGURE 4
Non‐vesicular extracellular nanoparticles have unique protein compositions. (A) Representative TEM photomicrographs of exomeres and supermeres isolated from GBM6, GBM39 and GBM59. Below; violin plot quantitation of particle diameters using ImageJ from exomeres and supermeres of GBM6, GBM39 and GBM59 n = 329, 423, 336, 341, 286, 238, respectively. Data are presented as the median (black dash) and upper and lower quartiles (colored dash) of biologically independent replicates (n = 3), for unpaired t test, two‐tailed, ****p < 0.0001. (B) Volcano plots of proteins from GBM6, GBM39 and GBM59 exomeres and supermeres versus cells. (C) Venn diagram of protein species preferentially present (Log2FC > 1) in exomeres and supermeres versus cells from GBM6, GBM39 and GBM59 PDX cells. (D) Heat map of Log2FC > 1 of proteins in exomeres and supermeres versus cells from DiFi, GBM6, GBM39 and GBM59 cells. Data are from biologically independent replicates (n = 4). (E) Venn diagram of the overlap and uniqueness in protein species preferentially present (Log2FC > 1) in GBM and DiFi supermeres and exomeres when compared to cells. Indicated are the 10 exomere and 33 supermere proteins that are present in GBMs and absent in DiFi cells. (F) Venn diagram of protein species present in GBM6, GBM39, GBM59 and DiFi exomeres and supermeres.
FIGURE 5
FIGURE 5
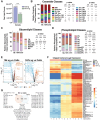
Lipidomes of exomeres and supermeres. (A) Total lipid counts of exomeres, supermeres and the 167k × g EV fractions isolated from GBM6, GBM39 and GBM39. (B) Relative lipid subclasses composition (percentage) for the indicated lipid classes. (C) Heat map of top ranked lipids of each indicated fractions. (D) Volcano plots of total lipids from exomeres versus supermeres in GBM6, GBM39 and GBM59.
FIGURE 6
FIGURE 6
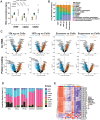
RNA distribution and composition of EVs and NVEPs. (A) Relative abundance of RNA isolated from 15k EVs, 167k EVs, exomeres and supermeres from GBM6, GBM39 and GBM59 PDX cells. Data are presented as the mean ± SEM of biologically independent replicates (n = 5), unpaired t test, two‐tailed, *p < 0.05, **p < 0.01, ***p < 0.001 and ****p < 0.0001. (B) Relative long‐RNA read counts (percentage) of the indicated RNA biotypes from RNAseq of cells, 15k EVs, 167k EVs, exomeres and supermeres of GBM39. Note that Misc_RNAs are mainly composed of RNA 7SL cytoplasmic pseudogenes, RN7SK pseudogenes, vault RNAs and Y RNAs. Data are presented as the mean ± SEM of biologically independent replicates (n = 4). (C) Volcano plots of log2FC abundance differences between the indicated EVs and NVEPs versus cells from GBM39 for the indicated long RNA biotypes. (D) Relative small‐RNA read counts of the indicated RNA biotypes from RNAseq of cells, 15k EVs, 167k EVs, exomeres and supermeres of GBM39. Data are presented as the mean ± SEM of biologically independent replicates (n = 2–4). yRNA, Y RNA‐derived sRNA; tRNA, tRNA‐derived sRNA; snoRNA, small nucleolar RNA‐derived sRNA; snRNA, small nuclear RNA‐derived sRNA; rRNA ribosomal RNA‐derived sRNA; Mt_tRNA, mitochondrial tRNA‐derived sRNA; osRNA, other sRNA; lncRNA, long non‐coding RNA‐derived sRNA; and miRNA, microRNA. (E) Heatmap of the top‐50 most abundant miRNAs across GBM39 cells and the indicated extracellular compartments.
FIGURE 7
FIGURE 7
Supermeres exhibit preferential CNS tissue uptake in vivo. (A) Representative NIR images of whole‐organ imaging. Male CD‐1 mice (n = 3) were injected (IV) with 150 µg (protein) (in 200 µL of PBS) of NIR‐labelled 15k EVs, 167k EVs, exomeres or supermeres derived from GBM6, GBM39 and GBM59 cells and the indicated organs were harvested after 24 h and imaged. (B) Brain accumulation of EVs and NVEPs. Quantitation of brain signal intensity of the indicated EVs and NVEPs labeled with NIR, 24 h post IV tail vein injected. Data are presented as the mean ± SEM of biologically independent replicates (n = 3), unpaired t test, two‐tailed, **p < 0.01, ***p < 0.001 and ****p < 0.0001. (C) Extravasation of supermeres into brain parenchyma. 150 µg (protein) (in 200 µL of PBS) NIR‐labeled GBM6, GBM39 and GBM59 supermeres were IV (tail vein) injected and 6 h later, fluorescently labeled lectin (5 mg/kg) was administered via tail vein injection 30 min prior to mouse euthanasia. (D, E) Whole‐organ imaging. Representative NIR images of organs (D) and quantitation (E) of NIR‐labeled GBM39 supermeres pretreated with DNase, RNase, or heat denatured IV injected in CD1 male mice and organ‐harvested and imaged 24 h post‐injections. 150 µg (protein) (in 200 µL of PBS) were injected. Data are presented as the mean ± SEM of biologically independent replicates (n = 3), unpaired t test, two‐tailed, *p < 0.05, **p < 0.01, and ***p < 0.001. (F, G) Representative photomicrographs of NIR image of GBM6, GBM39, GBM59 and GBL261 tumor‐bearing mouse brain. Mouse brains were harvested after 24 h of 150 ug (protein) (in 200 µL of PBS) of GBM6, GBM39 and GBM59 and HEK‐293 and GL261 NIR‐labeled supermeres IV injection (F) and quantitation (G). Data are presented as the mean ± SEM of biologically independent replicates (n = 3), unpaired t test, two‐tailed, *p < 0.05, **p < 0.01 and ***p < 0.001. (H, I) Representative photomicrographs (H) and quantification of signal intensity (I) of tumor‐bearing‐mouse brain tissue sections that were processed for immunofluorescence staining against Ki‐67 to identify GBM cells and imaged to detect NIR‐labeled supermeres. Scale bars = 1000 µm and 20 µm. Data are presented as the mean ± SEM of biologically independent replicates (n = 3), unpaired t test, two‐tailed, **p < 0.01, **p < 0.01, and ***p < 0.001.
FIGURE 8
FIGURE 8
Supermeres activate microglia. (A) Representative photomicrographs of immunofluorescence of mouse brain sections of mice IV injected with 150 µg (protein) (in 200 µL of PBS) of NIR‐labeled supermeres isolated from the indicated cells and imaged 48 h later, processed for brain sections and immunofluorescence to identify neuron (MAP2 and NeuN), microglia (IBA1), oligodendrocytes (MBP) and astrocytes (GFAP). Scale bars = 20 µm. (B) Quantitation (percentage) of indicated cell types positive for supermeres. Data are presented as the mean ± SEM of biologically independent replicates (n = 3), unpaired t test, two‐tailed, ****p < 0.0001. (C, D) Representative flow cytometry plot (C) and quantitation (D) of HMC3 microglial cells treated with 50 µg/mL of GBM6, GBM39, and GBM59 PDX cells NIR‐labeled supermeres for 6 h and analyzed. Data are presented as the mean ± SEM of biologically independent replicates (n = 3), unpaired t test, two‐tailed, ****p < 0.0001. (E) qRT PCR of the indicated genes of RNA isolated from HMC3 cells treated with LPS (100 ng/mL), and 50 µg/mL of GBM6, GBM39, GBM59 PDX, GL261 and HEK‐293 cells supermeres for 6 h. Data are presented as the mean ± SEM of biologically independent replicates (n = 3), unpaired t test, two‐tailed, *p < 0.05, **p < 0.01, ***p < 0.001 and ****p < 0.0001.

References

    1. Acquaviva, J. , Jun H. J., Lessard J., et al. 2011. “Chronic Activation of Wild‐Type Epidermal Growth Factor Receptor and Loss of Cdkn2a Cause Mouse Glioblastoma Formation.” Cancer Research 71, no. 23: 7198–7206. - PMC - PubMed
    1. Akkari, L. , Gocheva V., Kester J. C., et al. 2014. “Distinct Functions of Macrophage‐Derived and Cancer Cell‐Derived Cathepsin Z Combine to Promote Tumor Malignancy Via Interactions With the Extracellular Matrix.” Genes & Development 28, no. 19: 2134–2150. - PMC - PubMed
    1. An, Z. , Aksoy O., Zheng T., Fan Q. W., and Weiss W. A.. 2018. “Epidermal Growth Factor Receptor and EGFRvIII in Glioblastoma: Signaling Pathways and Targeted Therapies.” Oncogene 37, no. 12: 1561–1575. - PMC - PubMed
    1. Andre, M. , Chambrion C., Charrin S., et al. 2009. “In Situ Chemical Cross‐Linking on Living Cells Reveals CD9P‐1 Cis‐Oligomer at Cell Surface.” Journal of Proteomics 73, no. 1: 93–102. - PubMed
    1. Andronico, L. A. , Jiang Y., Jung S. R., et al. 2021. “Sizing Extracellular Vesicles Using Membrane Dyes and a Single Molecule‐Sensitive Flow Analyzer.” Analytical Chemistry 93, no. 14: 5897–5905. - PMC - PubMed