[Preprint]. 2025 Sep 28:2025.09.26.678874.
doi: 10.1101/2025.09.26.678874.

Behavioral Decoding Reveals Cortical Endocannabinoid Potentiation during Δ9-THC Impairment

Affiliations

Behavioral Decoding Reveals Cortical Endocannabinoid Potentiation during Δ9-THC Impairment

Anthony English et al. bioRxiv. .

Abstract

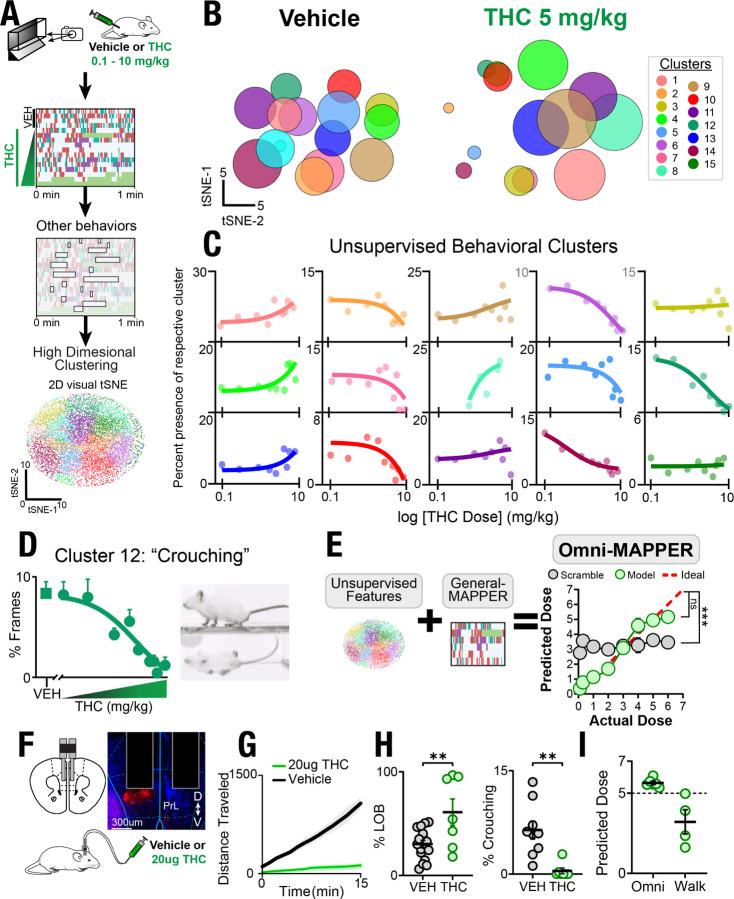
How Δ9-tetrahydrocannabinol (THC) impairs natural behaviors in mice remains unknown. We developed a video-monitored behavioral platform with machine learning classifiers to unravel discrete changes in natural mouse behaviors. THC infusion into the medial prefrontal cortex (mPFC) disrupted walking kinematic features characteristic of impairment responses. THC predominantly increased mPFC GABAergic activity preceding walk initiation shifting the mPFC excitatory/inhibitory (E/I) balance. Pose-defined closed loop photo-stimulation of mPFC GABAergic neurons demonstrated that THC exacerbates selected parameters of motor impairment. Surprisingly, THC also induced a time locked, movement-induced, transient potentiation of mPFC endocannabinoid (eCB) release and ensuing CB1R-mediated synaptic inhibition. Here we establish that THC-modifies mPFC E/I balance to excitation via dynamic changes in eCB release which acts to induce behavioral impairment.


Conflict of interest statement

Competing interests: Anthony English is the founder and CEO of BioSyft Inc., a company developing technologies for behavioral analysis in preclinical research. Michael Bruchas, Nephi Stella, and Benjamin Land are scientific advisors in BioSyft Inc. The other authors declare no competing interests.

Figures

Figure 1.
Figure 1.. Detection of THC-induced impairment signatures using machine learning and dose-prediction computational models:
A) Schematic of analysis pipeline for linear track recordings first analyzed with a supervised classification algorithm. B) Behavioral ethogram over 5 minutes in the linear track identifying core behaviors (grooming, rearing, walking, and laying on belly. Each row represented one mouse treated with vehicle or increasing doses of THC. C) THC dose-dependent response curves for percent time in four core behaviors as assessed by supervised classification algorithm after a two-day habituation period. D) Schematic of kinematic analysis as calculated by POIs during walk events. E) Kinematic metrics during walk events after increasing doses of THC with Z-scores standardized to vehicle treatment. F) Schematic for training random forest regression models to predict THC dose from general behaviors and from kinematic features. G) Dose prediction accuracy of general and kinematic behavioral models against a test set (green) and a dataset scrambled across doses (grey) compared to an ideal prediction (red). Nonlinear fit curve significance from ideal, ***p<0.0001. Full experimental dataset: vehicle (N=179) and THC (0.1–10 mg/kg: N = 10–35 each). Random forest regressor training set: THC (0.1–5 mg/kg: N = 16–35 each).
Figure 2.
Figure 2.. Unsupervised models reveal unique behavioral signatures of THC impairment mediated by mPFC activity:
A) Schematic of analysis pipeline for extracting nuanced “other” frames to generate features for high dimensional Kmeans clustering (N=179, 53% male, 47% female, treatment range vehicle, 0.3, 0.1, 1, 2, 3, 4, 5, 6, 7, or 10 mg/k THC). 2 dimensional (2D) tSNE shows representative segmentation of clusters. B) To visualize structure within the high-dimensional dataset, we applied a two-dimensional t-SNE to the 29-dimensional behavioral feature space. Vehicle and 5 mg/kg THC treated behavioral frames with unsupervised cluster centroids sized to relative contribution for given treatment. C) Relative expression per “other” contributions were plotted and THC dose-dependent effects of 16 identified clusters. D) Crouching “crouching” dose response curve along with a visual snapshot of behavior and 2D tSNE with cluster highlighted. E) Schematic for training of a random forest regressor for dose prediction by combining an unsupervised model using only nuanced behavioral clusters and the combination with the general model to train a Comprehensive behavioral dose prediction model. Nonlinear fit curve significance from ideal, ***p<0.0001. F) bi-lateral intracranial infusion of high concentration THC (10 ug each side). G) Standard behavioral effect of total distance traveled in linear track. H) Percent laying on belly and expression of Crouching exemplifies THC effect. I) Application of Comprehensive and kinematic dose prediction models reveals high dose THC behavioral presentation. N=7–15 Student’s unpaired T-test (**p<0.01).
Figure 3.
Figure 3.. THC modifies E/I balance in the mPFC during locomotor walk epochs:
A) mPFC injection of AAV-DJ-CAMKIIα-GCaMP6f for fiber photometry linear track experimentation. B) Time locked mPFCCAMKIIα neural signal at walk initiation during WT-CAMKII behavior. Averaged walk event traces after vehicle or 5 mg/kg THC treatment. C-D) Schematic and histology for Cre-dependent expression of GCaMP6f in mPFCvGLUT1 (A) and mPFCvGAT (B) neurons. Percent LOB and Crouching behavioral presentation in vehicle and 5 mg/kg THC-treated mPFCvGLUT1 neurons (C) and mPFCvGAT (D) neurons. E-F) Fiber photometry signal of glutamatergic (E) and GABAergic (F) neuron activity at walk initiation and subsequent heatmaps for each walk event. G-H) Peak Z-score (G) and Σ Z-score (6 s) (H) over neural recordings of walk events in mPFCvGLUT1-GCaMP6f and mPFCvGAT-GCaMP6f mice. I) Application of Comprehensive and Kinematic dose prediction models to VGLUT-GCaMP6f behavior during fiber photometry recording. J) Application of Comprehensive and Kinematic dose prediction models to VGAT-GCaMP6f behavior during fiber photometry recording. K) Cartoon schematic of mPFC neurons after THC administration during walk behavior. L) Schematic of electrophysiological recordings of mPFCvGLUT1 and mPFCvGAT neurons. M) Normalized oEPSC amplitude after optogenetic stimulation with and without THC bath reveals enhanced maximum DSE in mPFCvGAT neurons. N=8–14, Two-Way ANOVA with Sidak’s posttest and Student’s unpaired T-test (*P<0.05, **p<0.01, ***p<0.001).
Figure 4.
Figure 4.. Behavioral Decoding Coupled to Closed-loop Loop Optogenetics Establishes mPFCvGAT neurons as sufficient for eliciting THC-induced disrupted behavioral kinematics:
A) Schematic of bi-lateral AAV1-SaCas9-sgCnr1 or AAV1-SaCas9-sgROSA control injection and unilateral DIO-GCaMP6f injection with fiber implantation for fiber photometry. B) Microscopic images of mPFCvGLUT1-ROSA and mPFCvGLUT1-CRISPR tissue slices from RNAscope in situ hybridization. C-D) Fiber photometry signal at walk initiation of mPFCvGLUT1 (C) and mPFCvGAT (B) ROSA control (blue and orange) and CRISPR-expressing (purple) mice, shown as calculated Z-score. E-F) Peak Z-score (E) and Σ Z-score (6 s) (F) over neural recordings of walk events in mPFCvGAT-ROSA (orange, “Control”), and mPFCvGAT-CRISPR (orange and purple), mPFCvGLUT1-ROSA (blue, “Control”), and mPFCvGLUT1-CRISPR (blue and purple) recordings. G) Image of a mPFCvGAT-ROSA and mPFCvGAT-CRISPR mouse walking, mid-stride, with pose estimated labels. H) Schematic for closed-loop optogenetic experimentation within the linear track chamber where mice treated with THC (5 mg/kg) received photo-stimulation at walk initiation. I) Image of a mPFCvGAT-ChR2 mouse walk behavior with and without stimulation within video, mid-stride. J) Comprehensive and Kinematic dose prediction of behavior from mPFCvGLUT1-eYFP, mPFCvGLUT1-ChR2, mPFCvGAT-eYFP, and mPFCvGAT-ChR2 animals. Kinematic dose prediction only applied to walk events where stimulation occurred. K) Cartoon Schematic of mPFC after THC administration. N=5–10, Two-Way ANOVA and Student’s unpaired T-tests, (*p<0.05, **p<0.01).
Figure 5.
Figure 5.. THC induces potentiation of 2-AG transients and release by mPFCvGLUT1 neurons at walk initiation:
A) Schematic for GRABeCB2.0 expression and histology with optic fiber placement. B) Percent laying on belly and Crouching behavioral presentation across mPFCGRABeCB animals treated with vehicle, 1, 5, or 10 mg/kg. C) Fiber photometry signal of mPFCGRABeCB signal in WT mice treated with vehicle or a range of THC doses (1, 5, or 10 mg/kg) at walk initiation with their subsequent heatmaps for each walk event. D) Z-score (6 s) and peak Z-score from walk events. E) Dose prediction with Comprehensive and Kinematic dose prediction models for vehicle and THC-treated animals. F) Example fiber photometry trace of a 100 min experimental session with 10 mg/kg THC (green) injected systemically at 10 min. Animal was pre-treated 1 h before with 30 mg/kg DO34 before systemic injection of vehicle (black) or 5 mg/kg THC (purple). G) Fiber photometry signal at walk initiation after treatment with vehicle (black), 5 mg/kg THC (green), 30 mg/kg DO34 then 5 mg/kg THC (purple), or 20 mg/kg JZL-184 (maroon). H) Percent LOB and Crouching behavioral presentation across all eCB pharmacological treatments of vehicle (V), 10 mg/kg THC (T), 30 mg/kg DO34 + vehicle (D+V), 30 mg/kg DO34 + 10 mg/kg THC (D+T), and 20 mg/kg JZL-184 (J). I) Dose prediction of all eCB pharmacological treatments with total and kinematic behavioral models. J) Schematic for Cre-dependent expression of red-shifted opsin, ChrimsonR, and GRABeCB2.0 with hSyn promoter in vGLUT1-Cre (mPFCvGLUT1-GRABeCB) and vGAT-Cre (mPFCvGAT-GRABeCB) mice. ChrimsonR stimulation at 20 Hz (5 ms pulse width, 90 s ITI). K-L) mPFCvGLUT1-GRABeCB and mPFCvGAT-GRABeCB signal following a 10 s, 20Hz stimulation (5 ms pulse width). M) Cartoon schematic of local mPFC circuitry during walk behavior of THC-treated mice. N=7–16 Student’s unpaired T-tests, Two-Way ANOVA with multiple comparisons (**p<0.01, ***p<0.001).

References

    1. Pennypacker S. D., Cunnane K., Cash M. C., and Romero-Sandoval E. A.. Potency and therapeutic thc and cbd ratios: Us cannabis markets overshoot. Frontiers in Pharmacology, 13:921493, 2022. - PMC - PubMed
    1. Asbridge M., Hayden J. A., and Cartwright J. L.. Acute cannabis consumption and motor vehicle collision risk: systematic review of observational studies and meta-analysis. Bmj, 344:e536, 2012. - PMC - PubMed
    1. Van Den Elsen G. A., Tobben L., Ahmed A. I., Verkes R. J., Kramers C., Marijnissen R. M., et al. Effects of tetrahydrocannabinol on balance and gait in patients with dementia: A randomised controlled crossover trial. Journal of psychopharmacology, 31:184–191, 2017. - PubMed
    1. Stella N.. Thc and cbd: Similarities and differences between siblings. Neuron, 111:302–327, 2023. - PMC - PubMed
    1. McCartney D., Suraev A. S., Doohan P. T., Irwin C., Kevin R. C., Grunstein R. R., et al. Effects of cannabidiol on simulated driving and cognitive performance: a dose-ranging randomised controlled trial. Journal of psychopharmacology, 36:1338–1349, 2022. - PMC - PubMed

Publication types

LinkOut - more resources