[Preprint]. 2025 Sep 22:2024.11.28.625926.
doi: 10.1101/2024.11.28.625926.

Targeted glycophagy ATG8 therapy reverses diabetic heart disease in mice and in human engineered cardiac tissues

Affiliations

Targeted glycophagy ATG8 therapy reverses diabetic heart disease in mice and in human engineered cardiac tissues

K M Mellor et al. bioRxiv. .

Update in

Abstract

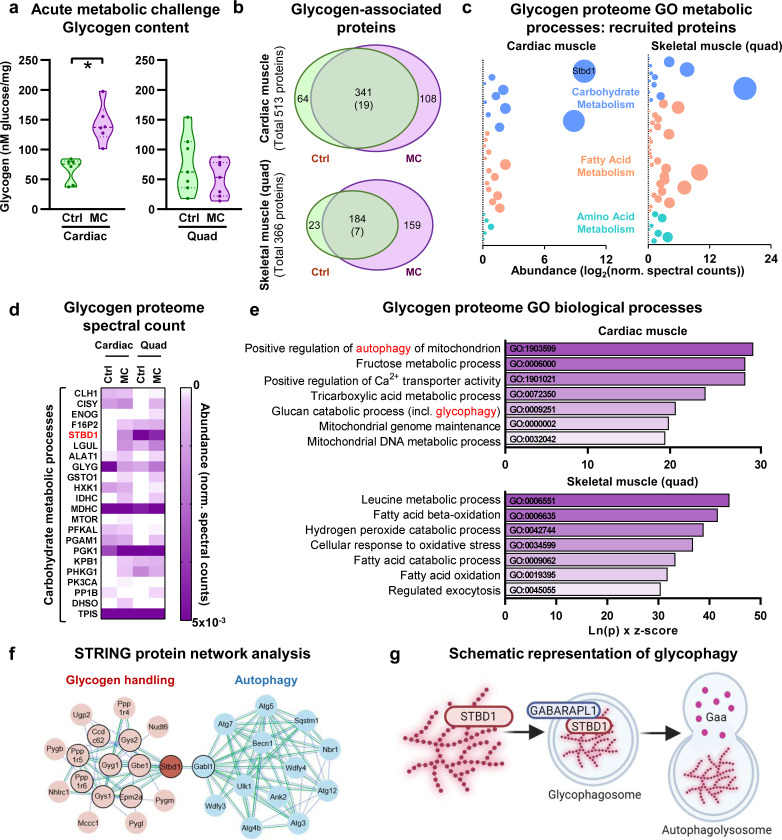
Diabetic heart disease is highly prevalent and is associated with the early development of impaired diastolic relaxation. The mechanisms of diabetic heart disease are poorly understood and it is a condition for which there are no targeted therapies. Recently, disrupted glycogen-autophagy (glycophagy) and glycogen accumulation have been identified in the diabetic heart. Glycophagy involves glycogen receptor binding and linking with an ATG8 protein to locate and degrade glycogen within an intracellular phago-lysosome. Here we show that glycogen receptor protein STBD1 (starch-binding-domain-protein-1) is mobilized early in the cardiac glycogen response to metabolic challenge in vivo, and that deficiency of a specific ATG8 family protein, Gabarapl1 (γ-aminobutyric-acid-receptor-associated-protein-like-1) is associated with diastolic dysfunction in diabetes. Gabarapl1 gene delivery treatment remediated cardiomyocyte and cardiac diastolic dysfunction in type 2 diabetic mice and diastolic performance of 'diabetic' human iPSC-derived cardiac organoids. We identify glycophagy dysregulation as a mechanism and potential treatment target for diabetic heart disease.


Conflict of interest statement

COMPETING INTERESTS The authors declare no competing financial interests.

Figures

Fig.1 |
Fig.1 |. Glycophagy mediator proteins are mobilized early in cardiac glycogen response to metabolic challenge in vivo.
a, Heart glycogen is increased in rats subjected to an acute metabolic challenge (MC, 48 hr post-streptozotocin injection) and skeletal muscle glycogen is unchanged (analyzed by unpaired 2-sided T-Test. Heart: n=6 animals/group, p=0.0006. Skeletal muscle: n=7 animals/group, p=0.28). b, Glycogen proteome in cardiac and skeletal (quadriceps) muscle response to an acute metabolic challenge in vivo. Venn diagram values show the number of unique or differentially abundant proteins in control (Ctrl) vs metabolic challenge (MC) samples using LC-MS/MS. Total number of significantly up- or down-regulated proteins shown in brackets. n=4 animals /group. c, The glycogen proteome response to an acute metabolic challenge is characterized by changes in proteins related to carbohydrate and amino acid metabolism in cardiac muscle, contrasting with skeletal muscle where changes in fatty acid metabolism related proteins are most evident. Data are derived from spectral counts of uniquely present proteins in acute metabolic challenge rat tissue from Carbohydrate (GO:0005975), Fatty Acid (GO:0006629) or Amino Acid (GO:0006520) Metabolic Process GO categories, detected by LC-MS/MS (n=4 animals/group). Bubble size is indicative of protein abundance. d, The glycophagy tagging protein, Stbd1 (starch-binding domain-containing protein 1) is detected as a component of the cardiac glycogen proteome only in acute metabolic challenge cardiac muscle (but not in control), whereas Stbd1 is present in both metabolic challenge and control skeletal muscle glycogen proteome. The heatmap is derived from LC-MS/MS normalized spectral counts of differentially abundant or uniquely detected proteins in the Carbohydrate Metabolic Processes GO category (GO:0005975), with normalized spectral abundance factor adjustment (n=4 animals /group). e, Glycophagy is identified as a key biological process in the cardiac glycogen proteome response to an acute metabolic challenge in vivo. The gene ontology (GO) categories with the highest combined score (Ln(p) x z-score) are presented, comprising glycogen proteome proteins uniquely detected or differentially abundant between metabolic challenge and control for heart and skeletal muscle (n=4 animals/group). f, Functional analysis network (STRING) of known and predicted protein interactions with Stbd1. Gabarapl1 is identified as a primary interactor with Stbd1 and a link between glycogen handling and autophagy. Primary interactions are depicted by black outline. Associations are derived from experimental evidence (continuous green line) and text mining evidence (dashed blue line). g, Schematic illustrating three stages of glycophagy. Stbd1 tags glycogen and binds to the Atg8 protein, Gabarapl1 (GABA receptor-associated protein-like 1), at the forming glycophagosome membrane. The mature glycophagosome fuses with a lysosome where Gaa (acid α-glucosidase) degrades glycogen to free glucose for metabolic recycling. Made with Biorender Data are presented as mean ± s.e.m. *p<0.05. See also Extended Data Figure 1 and Extended Data Table 1.
Fig.2 |
Fig.2 |. Cardiac Gabarapl1 (Atg8) deficiency is associated with diastolic dysfunction in diabetes in vivo and induces glycogen accumulation in vitro.
a, Diastolic dysfunction (increased echocardiographic index, E/e’ ratio, p=0.0024) and myocardial glycogen accumulation (p=0.0397) are evident in type 2 diabetic mice (T2D, high fat diet, unpaired 2-sided T-Test). Myocardial glycogen content and diastolic dysfunction (E/e’ ratio) are correlated for control (blue) and T2D (pink) mice (r, Pearson correlation coefficient, Ctrl: n=9 and T2D: n=10 animals/group). b, Cardiac mRNA expression of glycophagy markers in T2D mice. Gabarapl1 is decreased (p=0.0045) and Stbd1 and Gaa mRNA are unchanged (Ctrl Gabarapl1, Gaa: n=10 animals/group, Ctrl Stbd1, T2D Stbd1, Gabarapl1 & Gaa: n=9 animals/group, unpaired 2-sided T-Test). c, Schematic depicting small interfering RNA (siRNA) gene silencing experimental design using a pool of 4 siRNA sequences (si1–4) targeting Gabarapl1 for gene knockdown in neonatal rat ventricular myocytes (NRVM). d, Confirmation of siRNA-induced Gabarapl1 mRNA knockdown (siGab) in NRVMs (n=3 independent wells, p=0.019, unpaired 2-sided T-test). e, Cardiomyocyte glycogen content increased in NRVMs in response to Gabarapl1 knockdown (Scr: n=14, siGab: n=15 wells from 3 biologically independent cell culture experiments, p=0.0036, unpaired 2-sided T-test). Data are presented as mean ± SEM. *p<0.05. See also Extended Data Figure 2 and Extended Data Table 2,3,&4.
Fig.3 |
Fig.3 |. Gabarapl1 knockdown induces diastolic dysfunction and cardiac glycogen accumulation in mice.
a, Schematic of Crispr/Cas9 genome editing design targeting Gabarapl1 for gene deletion in mice. Global Gabarapl1 knockdown did not affect b, body weight (WT: n=8, KO/WT: n=12 animals/group, unpaired 2-sided T-test), c, glucose tolerance (WT: n=3, KO/WT: n=7 animals/group, repeated measures ANOVA with Bonferroni post-hoc), or d, blood glucose levels (WT: n=8, KO/WT: n=12 animals/group, unpaired 2-sided T-test). Despite no effect on systemic parameters, a cardiac phenotype was evident. e, M-mode echocardiography exemplar traces from left ventricular short axis view (upper panels) and pulse wave flow doppler (lower panels) in wildtype (WT/WT) and heterozygote Gabarapl1-KO mice (KO/WT). f, Systolic function was maintained in heterozygote Gabarapl1-KO mice (WT: n=8, KO/WT n=11–12 animals/group, unpaired 2-sided T-test). g, Heterozygote Gabarapl1-KO mice exhibit diastolic dysfunction, shown by increased E/e’ ratio (WT: n=8, KO/WT n=12 animals/group, unpaired 2-sided T-test, p=0.043). h, Cardiac glycogen content is increased in neonate (p2, age 2 day, WT: n=12, KO/WT: n=9 animals/group, p=0.034) and adult (age 20 week) heterozygote Gabarapl1-KO mice (WT: n=7, KO/WT: n=5 animals/group, unpaired 2-sided T-test, p=0.004). i, Periodic-acid Schiff (PAS) stained myocardial sections of 20 week old heterozygote Gabarapl1-KO mice show increased glycogen (pink-purple) staining (scale bar 50μm). Representative micrographs were selected from a gallery of images acquired from 2 animals/group. Data presented as mean ± s.e.m. *p<0.05. See also Extended Data Figure 2 and Extended Data Table 3.
Fig.4 |
Fig.4 |. AAV Atg8 gene delivery rescues cardiomyocyte and cardiac diastolic dysfunction in diabetic mice.
a, Schematic of AAV9 cardiac Gabarapl1 gene delivery construct. Made with Biorender. b, Cardiomyocyte glycogen is increased with exposure to high glucose in Null-treated but not AAV-Gabarapl1 treated cells (Ctrl-Null: n=8, HG-Null: n=15, Ctrl-Gab n=8, HG-Gab: n=16 independent culture wells/group, 2-way ANOVA with Bonferroni post-hoc, Null Ctrl v HG p<0.0001, HG Null vs Gab p=0.0001). c, In vivo cardiac-specific AAV9-cTnT-Gabarapl1 gene delivery does not affect the development of obesity in T2D mice (induced by high fat high sugar diet; open circles control diet, shaded circles T2D; Ctrl-Null, Ctrl-Gab, T2D-Null: n=10, T2D-Gab n=14 animals/group, repeated measures ANOVA with Bonferroni post-hoc, p<0.0001). d, T2D-induced glucose intolerance is not affected by in vivo cardiac-specific AAV-Gab gene delivery (open circles control diet, shaded circles T2D; Ctrl-Null n=5, Ctrl-Gab, T2D-Null, T2D-Gab: n=6 animals/group, repeated measures ANOVA with Bonferroni post-hoc, p<0.01). Baseline (time 0) fasted blood glucose levels are significantly elevated with T2D (2-way ANOVA T2D effect, p=0.019). e, Cardiac glycogen accumulation in T2D mice is rescued by cardiac Gabarapl1 gene delivery (13 weeks post-AAV injection, presented as fold change vs Ctrl-fed mice for each virus group, pre-AAV n=10 animals/group, post-AAV T2D-Null n=11, post-AAV T2D-Gab n=13, analyzed by 2-way ANOVA with Bonferroni post-hoc, post-AAV T2D-Gab vs T2D-Null p=0.0276). f, T2D-induced diastolic dysfunction (E/e’ ratio, echocardiography) is rescued by cardiac Gabarapl1 gene delivery in AAV-transduced mice (presented as fold change vs Ctrl mice for each virus group. T2D-Null pre- & post-AAV n=10, T2D-Gab pre-AAV n=14, T2D-Gab post-AAV n=13 animals/group, analysed by repeated measures ANOVA, post-AAV T2D-Gab vs T2D-Null p=0.028). g, Diastolic function (E/e’) is inversely correlated with Gabarapl1 protein expression in the membrane-enriched fraction of protein homogenates from T2D mice (high fat diet) injected with AAV-Gab virus (12–13 weeks post-AAV injection, r, Pearson correlation coefficient). h, Single intact cardiomyocyte force traces (exemplar) show rescued diastolic force (an indicator of passive stiffness) with cardiac Gabarapl1 gene delivery in diabetic mice (AAV9-cTnT-Gabarapl1; T2D, high fat diet; 24 weeks post-AAV injection). i, T2D-induced cardiomyocyte diastolic stiffness is rescued by cardiac Gabarapl1 gene delivery in diabetic mice (end-diastolic force-length relation slope; isolated stretched cardiomyocytes from mice at 24 weeks post-AAV injection, high fat diet, Ctrl-Null n=14, T2D-Null n=16, Ctrl-Gab n=15, T2D-Gab n=11 cells/group. Analyzed by 2-way ANOVA with Bonferroni post-hoc, T2D-Null vs Ctrl-Null p=0.022, T2D-Gab v T2D-Null p=0.032). Data are presented as mean ± s.e.m, *p<0.05. See also Extended Data Figure 3 & Extended Data Table 5&6.
Fig.5 |
Fig.5 |. AAV Atg8 gene delivery in vivo expedites cytosolic Ca2+ removal during cardiomyocyte relaxation in diabetic mice.
a, Exemplar Ca2+ transients recorded at basal length from AAV-Null or AAV-Gab T2D mice 24 weeks post-injection expressed as a percentage of peak amplitude (avg 10 contraction cycles, 2Hz). A mono-exponential decay fit is depicted with dark bold solid lines for each transient and 50 and 90% from peak to baseline are indicated with black broken lines. b, Cardiomyocyte Ca2+ time to peak is unchanged by T2D or Gabarapl1 gene delivery (Ctrl-Null n=12, T2D-Null n=13, Ctrl-Gab n=12, T2D-Gab n=8 cells, analyzed by 2-way ANOVA). c, Cardiomyocyte Ca2+ transient 90% decay is faster in diabetic mice treated with Gabarapl1 gene delivery (Ctrl-Null n=12, T2D-Null n=13, Ctrl-Gab n=11, T2D-Gab n=8 cells, analyzed by 2-way ANOVA with Bonferroni post-hoc, T2D-Gab v T2D-Null p=0.021) d, Accelerated cytosolic Ca2+ removal becomes more pronounced at the later stage of Ca2+ transient decay. Note, 0% decay is time to peak. (Ctrl-Null n=12–13, T2D-Null n=13–14, Ctrl-Gab n=11–13, T2D-Gab n=8–9 cells, analyzed by 2-way ANOVA with Bonferroni post-hoc, T2D-Gab v T2D-Null 90% decay p=0.031). Data are presented as mean ± s.e.m, *p>0.05. See also Extended Data Figure 3 & Extended Data Table 6.
Fig.6 |
Fig.6 |. AAV Atg8 gene delivery improves diastolic performance in ‘diabetic’ human iPSC-derived cardiac organoids.
a, Illustrative confocal image of a human pluripotent stem cell-derived cardiac organoid, stained for α-actinin (red) and DNA (blue, Hoescht stain). b, Transmission electron microscopy images of cardiac organoids showing increased glycogen deposits (black dots) in HG-treated organoids. High magnification image of a glycophagosome in an HG-treated organoid. Scale bar, 1μm. Representative electron micrographs were selected from a gallery of 4 images for control and 5 images for hyperglycemia conditions. c, Exemplar force traces from human cardiac organoids, normalized systolic force. d, HG-induced diastolic dysfunction (delayed time to 50% relaxation of force) is rescued by AAV9-Gabarapl1 transduction in human cardiac organoids (Ctrl-Null n=13, HG-Null n=19, Ctrl-Gab n=16, HG-Gab n=14 organoids, analyzed by 2-way ANOVA with Bonferroni post-hoc, HG-Null v Ctrl-Null p<0.0001, HG-Gab v HG-Null p=0.012). e, Systolic function (active force production) is unchanged with HG and Gabarapl1 gene delivery (Ctrl-Null n=12, HG-Null n=19, Ctrl-Gab n=15, HG-Gab n=13 organoids, analyzed by 2-way ANOVA). Data are presented as mean ± s.e.m, *p<0.05. See also Extended Data Figure 3.
Fig.7 |
Fig.7 |. Proposed cellular mechanism.
A hypothetical mechanism of glycophagy role in physiology and pathology involvement in diabetic heart disease. Created with Biorender.com.

References

    1. Hoek A. G. et al. Epidemiology of heart failure in diabetes: a disease in disguise. Diabetologia 67, 574–601 (2024). - PMC - PubMed
    1. Mellor K. M. et al. Myocardial glycophagy flux dysregulation and glycogen accumulation characterize diabetic cardiomyopathy. Journal of Molecular and Cellular Cardiology 189, 83–89 (2024). - PubMed
    1. Delbridge L. M. D., Mellor K. M., Taylor D. J. & Gottlieb R. A. Myocardial stress and autophagy: mechanisms and potential therapies. Nat Rev Cardiol 14, 412–425 (2017). - PMC - PubMed
    1. Koutsifeli P. et al. Glycogen-autophagy: Molecular machinery and cellular mechanisms of glycophagy. J Biol Chem 298, 102093 (2022).
    1. Varma U., Koutsifeli P., Benson V. L., Mellor K. M. & Delbridge L. M. D. Molecular mechanisms of cardiac pathology in diabetes - Experimental insights. Biochim Biophys Acta Mol Basis Dis 1864, 1949–1959 (2018). - PubMed

Publication types