[Preprint]. 2025 Sep 22:2025.09.22.677712.
doi: 10.1101/2025.09.22.677712.

Mechanisms of superior respiratory IgA responses against SARS-CoV-2 after mucosal vaccination

Affiliations

Mechanisms of superior respiratory IgA responses against SARS-CoV-2 after mucosal vaccination

Jinyi Tang et al. bioRxiv. .

Abstract

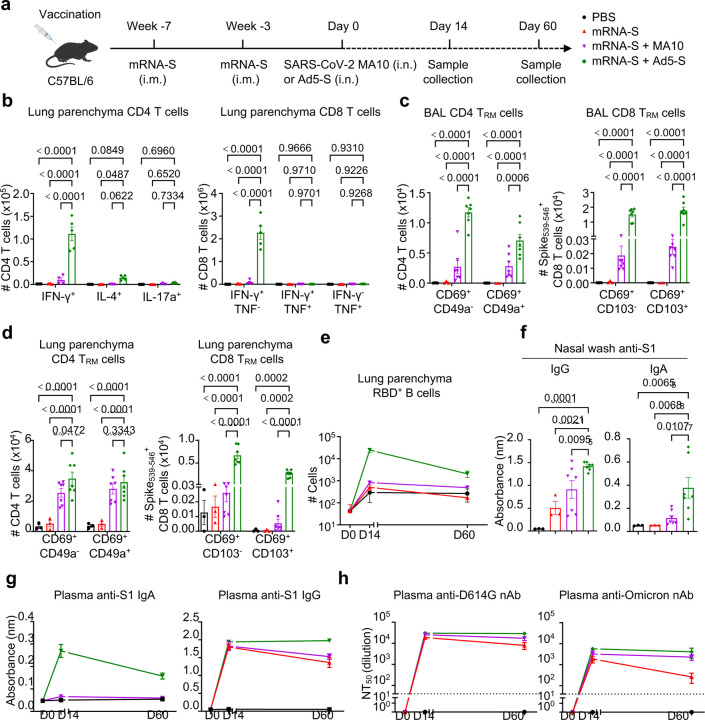
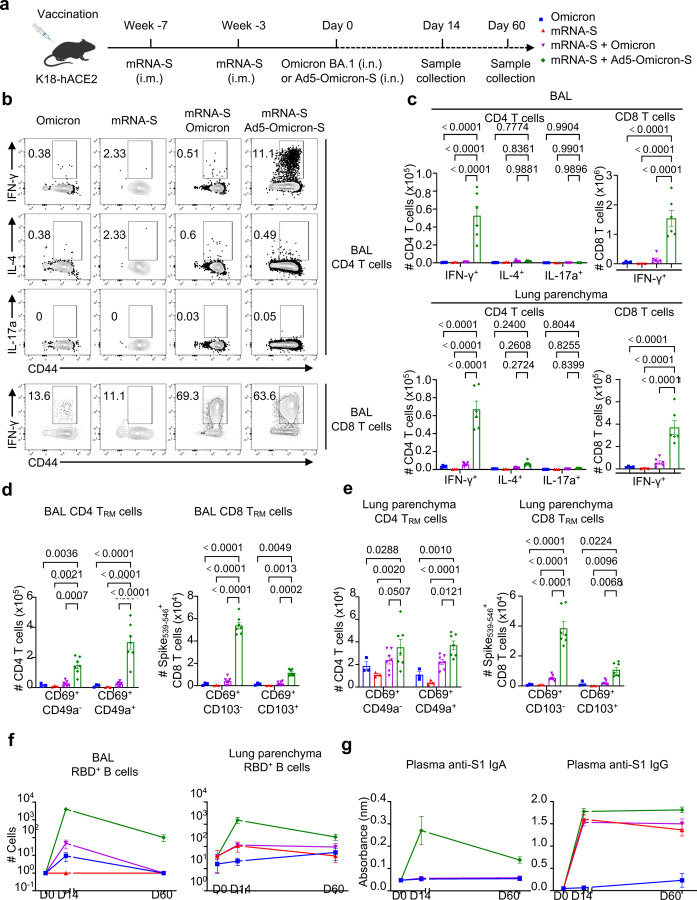
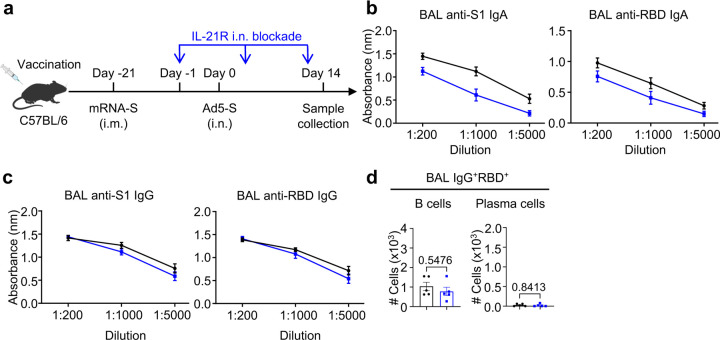
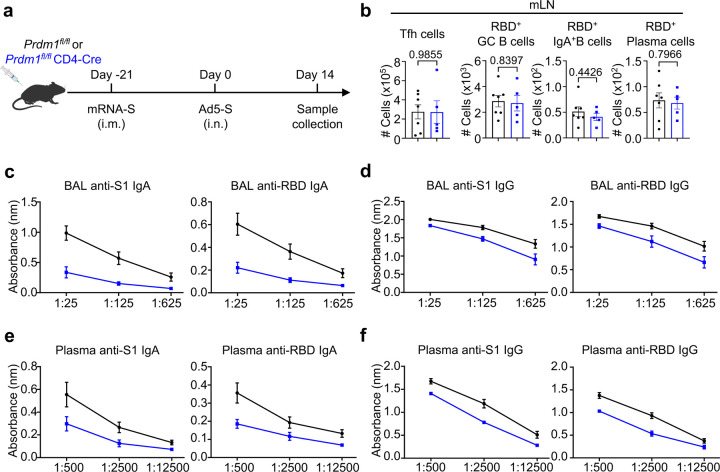
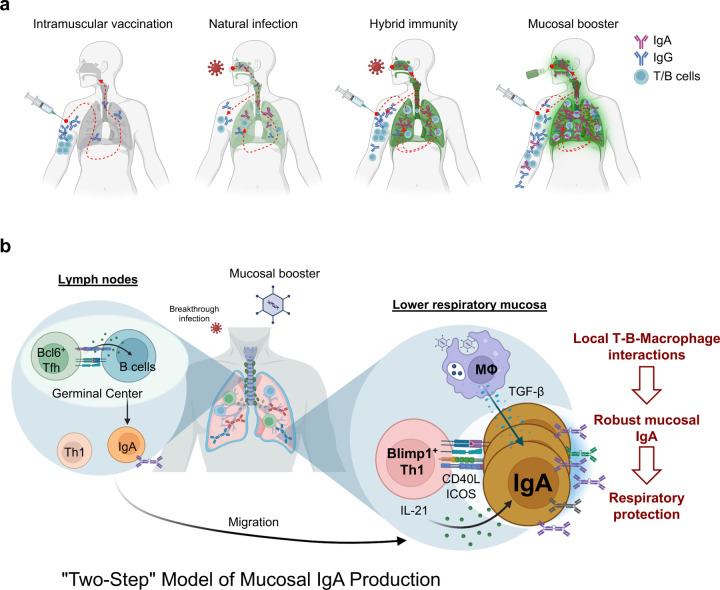
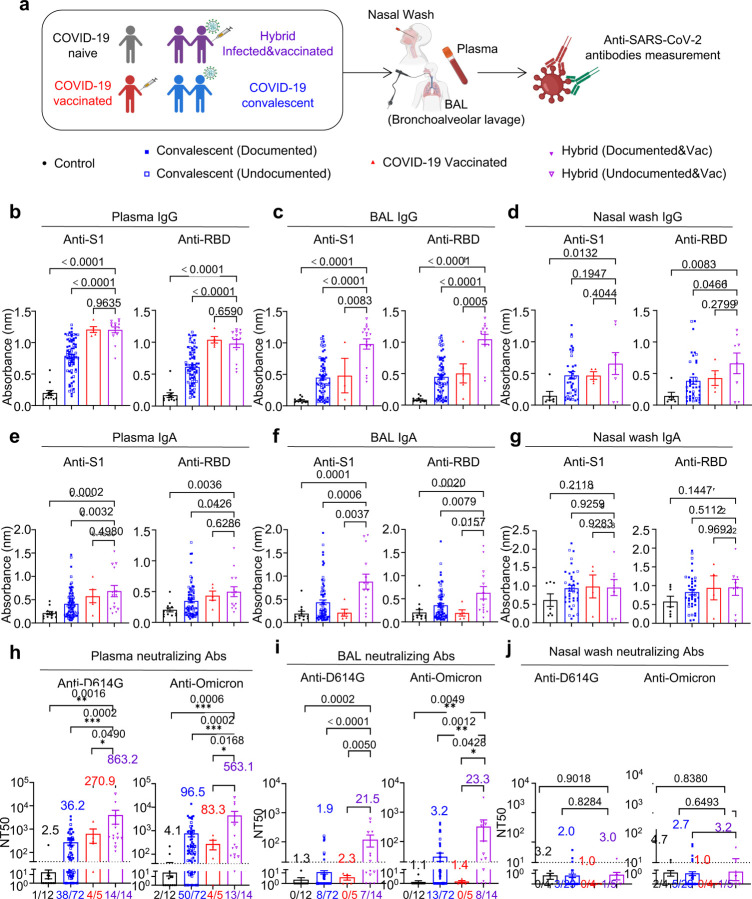
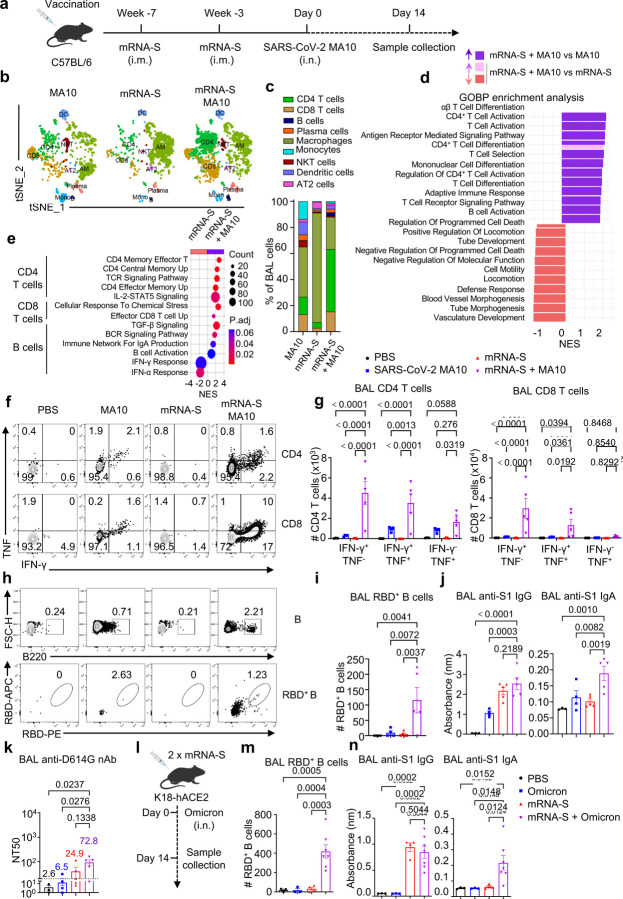
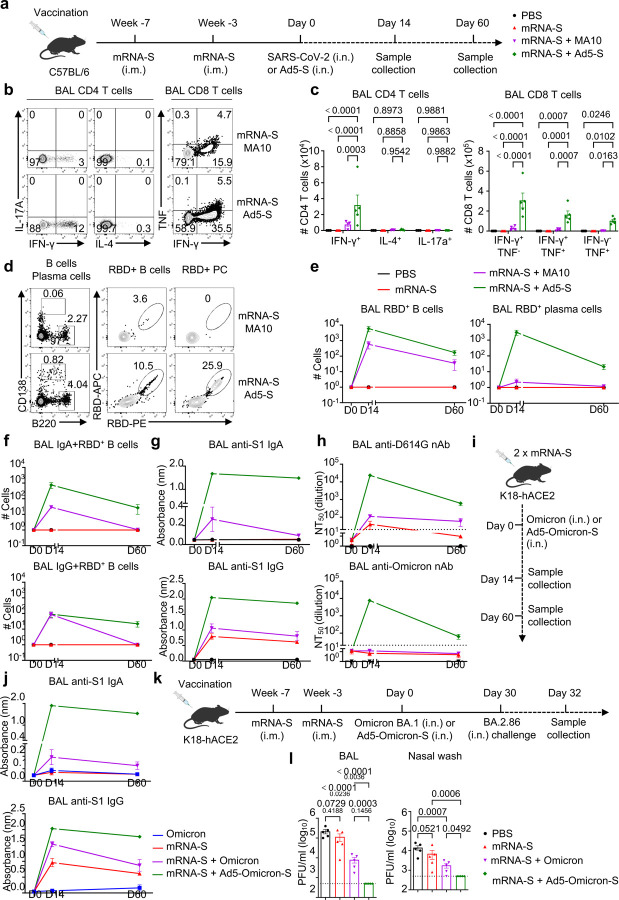
Mucosal immunization and respiratory IgA offer significant promise in protecting against airborne pathogens, including SARS-CoV-2. However, the conditions and mechanisms that lead to the robust induction of respiratory IgA responses following mucosal vaccination remain poorly understood. It is also currently debatable whether mucosal vaccination is still warranted given that most individuals in developed countries have established a hybrid immunity from vaccination and infection. Here we characterized respiratory mucosal immune responses after SARS-CoV-2 infection, vaccination or both in humans. We found that hybrid immunity resulted in moderately increased respiratory IgA and neutralizing antibody responses compared to infection or vaccination alone. However, a direct comparison of hybrid immunity and a mucosal adenovirus-based booster vaccination in animal models revealed that respiratory booster immunization elicited markedly stronger and more durable respiratory IgA, T cell response, and protective immunity against SARS-CoV-2, supporting the promise of respiratory mucosal vaccination. Mechanistically, we found that mucosal booster immunization induced local IgA-secreting cells in the respiratory mucosa, aided by pulmonary CD4+ T cells in situ. Strikingly, local IL-21-producing Blimp-1+ Th1 effector cells were critical in mediating the CD4+ T cell help for respiratory IgA production. Furthermore, lung macrophages were important for this respiratory IgA response via the production of TGF-β. Consequently, we demonstrated delivery of adenoviral booster to the lower airway was necessary to generate robust upper and lower airway IgA responses. Collectively, our results uncover a local cellular network supporting enhanced respiratory IgA responses, with implications for the development of optimal mucosal immunization strategies against SARS-CoV-2 and other respiratory pathogens.


Figures

Extended Data Fig.1:
Extended Data Fig.1:. Systemic and respiratory mucosal Ab responses in individuals with SARS-CoV-2 vaccination and infection.
a, Levels of SARS-CoV-2 N binding IgG in plasma and BAL of COVID-19 naïve individuals (n = 12), COVID-19 convalescents (n = 75), COVID-19 vaccinated individuals (n = 5), vaccinated plus infected individuals (n = 14). Individuals with undocumented COVID-19 infection are indicated as hollow symbols in groups of COVID-19 convalescents and COVID-19 vaccinated plus infected. b-g, Correlations between BAL IgG and plasma IgG (b), BAL IgA and plasma IgA (c), BAL IgG and nasal wash IgG (d), BAL IgA and nasal wash IgA (e), plasma IgG and nasal wash IgG (f), plasma IgA and nasal wash IgA (g). Individuals with hybrid immunity are indicated as red symbols. Enrolled donors’ demographics are provided in Extended Data table 1. a, One-way ANOVA with multiple-comparisons test. Data presented as mean ± s.e.m. b-g, Simple linear regression analysis with 95% confidence band of the best-fit line.
Extended Data Fig.2:
Extended Data Fig.2:. scRNA-seq analysis of hybrid immunity.
a-b, scRNA-seq UMAP plots of BAL cells from mice at day 6 post SARS-CoV-2 MA10 infection or without infection. c, Heatmap of key gene expression in different clusters from scRNA-seq analysis. d, Volcano plots of differential expression of genes of CD4+ and CD8+ T cells in the BAL between indicated groups. e, Enrichment of upregulated pathways in BAL CD4+, CD8+ T and B cells from mRNA-S+ MA10 group versus MA10 group.
Extended Data Fig.3:
Extended Data Fig.3:. Systemic and respiratory mucosal immunity in vaccination plus SARS-CoV-2 MA10 infection model.
a, Schematic of experimental design. C57BL/6 mice were immunized as indicated (PBS, n = 3; SARS-CoV-2 MA10, n = 4; mRNA-S, n = 5; mRNA-S + MA10, n =5). b-e, Represented flow cytometry plot (b,d) and summary (c,e) of SARS-CoV-2 peptide-specific CD4+, CD8+ T cell (b,c) and RBD-specific B cell responses (d,e) in lung parenchyma from different groups. f, SARS-CoV-2 RBD-specific IgG and IgA responses in the BAL from different groups. g,h, SARS-CoV-2 S1- or RBD-specific IgG (g) and IgA (h) responses in the plasma from different groups. c, Two-way ANOVA with multiple-comparisons test; e-h, one-way ANOVA with multiple-comparisons test. Data presented as mean ± s.e.m. Data are representative of two independent experiments with similar results.
Extended Data Fig.4:
Extended Data Fig.4:. Systemic and respiratory mucosal immunity in vaccination plus SARS-CoV-2 Omicron infection model.
a, Schematic of experimental design. K18-hACE2 mice were immunized as indicated (PBS, n = 3; SARS-CoV-2 Omicron BA.1, n = 3; mRNA-S, n = 4; mRNA-S + Omicron BA.1, n =7). b,c, Summary of SARS-CoV-2 peptide-specific CD4+, CD8+ T cell in the BAL and lung parenchyma (b) and RBD-specific B cell responses (c) in lung parenchyma from different groups. d, SARS-CoV-2 RBD-specific IgG and IgA responses in the BAL from different groups. e,f, SARS-CoV-2 S1- or RBD-specific IgG (e) and IgA (f) responses in the plasma from different groups. b-f, One-way ANOVA with multiple-comparisons test. Data presented as mean ± s.e.m. Data are representative of two independent experiments with similar results.
Extended Data Fig.5:
Extended Data Fig.5:. Comparative analyses of the mucosal immunity after vaccination plus SARS-CoV-2 MA10 infection, and mucosal booster vaccination.
a, Schematic of experimental design. C57BL/6 mice were immunized as indicated (Day 0, n = 3; Day 14, PBS, n = 3; mRNA-S, n = 5; mRNA-S + MA10, n =4; mRNA-S + Ad5-S, n =5; Day 60, PBS, n = 3; mRNA-S, n = 3; mRNA-S + MA10, n =7; mRNA-S + Ad5-S, n =7). b, Summary of SARS-CoV-2 peptide-specific CD4+ T subsets, CD8+ T cell at day 14. c,d, Summary of CD4 and CD8 TRM cells in the BAL (c) and lung parenchyma (d) at day 60. e, SARS-CoV-2 RBD-specific B cell dynamic response in lung parenchyma. f, SARS-CoV-2 S1-specific IgA and IgG responses in the nasal wash from different groups. g, SARS-CoV-2 S1-specific IgA and IgG dynamic responses in the plasma from different groups. h, SARS-CoV-2-specific neutralizing Ab response against D614G and Omicron BA.1 in the plasma from different groups. b-d, Two-way ANOVA with multiple-comparisons test; f, one-way ANOVA with multiple-comparisons test. Data presented as mean ± s.e.m. Data are representative of two independent experiments with similar results.
Extended Data Fig.6:
Extended Data Fig.6:. Comparative analyses of the mucosal immunity after vaccination plus SARS-CoV-2 Omicron infection, and mucosal booster vaccination.
a, Schematic of experimental design. Schematic of experimental design. K18-hACE2 mice were immunized as indicated (Day 0, n = 3; Day 14, Omicron BA.1, n = 4; mRNA-S, n = 3; mRNA-S + Omicron BA.1, n =6; mRNA-S + Ad5-Omicron-S, n =6; Day 60, Omicron BA.1, n = 3; mRNA-S, n = 3; mRNA-S + Omicron BA.1, n =7; mRNA-S + Ad5-Omicron-S (BA.1), n =7). b,c, Represented flow cytometry plot (b) and summary (c) of SARS-CoV-2 peptide-specific CD4+ T subsets, CD8+ T cell at day 14. d,e, Summary of CD4 and CD8 TRM cells in the BAL (d) and lung parenchyma (e) at day 60. f, SARS-CoV-2 RBD-specific B cell dynamic response in the BAL and lung parenchyma. g, SARS-CoV-2 S1-specific IgA and IgG dynamic responses in the plasma from different groups. c-e, Two-way ANOVA with multiple-comparisons test. Data presented as mean ± s.e.m. Data are representative of two independent experiments with similar results.
Extended Data Fig.7:
Extended Data Fig.7:. CD4+, but not CD8+, T cell help is required for mucosal IgA responses during mucosal booster.
a-f, C57BL/6 mice were immunized as indicated (ctrl, n = 9; CD4 i.p. depletion, n = 8; CD8 i.p. depletion, n = 5). Schematic of experimental design (a); SARS-CoV-2 RBD-specific IgA or IgG positive B cell and plasma cell responses (b) in the BAL. SARS-CoV-2 S1- or RBD-specific IgA (c,e) and IgG (d,f) responses in the BAL (c,d) and plasma (e,f). b, One-way ANOVA with multiple-comparisons test. Data presented as mean ± s.e.m. Data are pooled from two independent experiments.
Extended Data Fig.8:
Extended Data Fig.8:. Optimal mucosal IgA responses are supported by T-B interactions in situ.
a-f, C57BL/6 mice were immunized as indicated (Ctrl, n = 5; CD4 i.n. depletion, n = 4). Schematic of experimental design (a); CD4+ T cell responses in the BAL, lung parenchyma and draining lymph nodes (b); SARS-CoV-2 RBD-specific IgA and IgG responses in the BAL (c); SARS-CoV-2 S1- or RBD-specific IgA (d) and IgG (e) responses in the plasma and SARS-CoV-2 RBD-specific IgG positive B cell and plasma cell responses in the BAL (f). g-k, C57BL/6 mice were immunized as indicated (FTY720 treated ctrl, n = 5; FTY720 treatment plus CD4 i.p. depletion, n =4). Schematic of experimental design (g); Percentage of CD4+ T and B cells in the blood before or after FTY720 treatment (h); CD4+ T cell response in the BAL (i); SARS-CoV-2 RBD-specific IgA and IgG responses (j) and SARS-CoV-2 RBD-specific IgG positive B cell and plasma cell responses (k) in the BAL. l-p, C57BL/6 mice were immunized as indicated (Ctrl, n = 13; ICOSL and CD40L i.n. blockade, n =8; ICOSL and CD40L i.p. blockade, n =4). Schematic of experimental design (l); SARS-CoV-2 RBD-specific IgA and IgG responses (m); SARS-CoV-2 RBD-specific IgG positive B cell and plasma cell responses (n) in the BAL; SARS-CoV-2 RBD-specific IgA (o) or IgG (p) positive B cell and plasma cell responses in the draining lymph nodes. b-f, i-k, Unpaired two-sided t-test; h, two-way ANOVA with multiple-comparisons test; m-p, one-way ANOVA with multiple-comparisons test. Data presented as mean ± s.e.m. a-k, Data are representative of two independent experiments with similar results. l-p, Data are pooled from two independent experiments.
Extended Data Fig.9:
Extended Data Fig.9:. Optimal mucosal IgA responses are supported by local IL-21 signaling.
a-d, C57BL/6 mice were immunized as indicated (Ctrl, n = 5; IL-21R i.n. blockade, n = 5). Schematic of experimental design (a); SARS-CoV-2 S1- or RBD-specific IgA (b) and IgG (c) antibody responses and SARS-CoV-2 RBD-specific IgG positive B cell and plasma cell responses (d) in the BAL. d, Unpaired two-sided t-test. Data presented as mean ± s.e.m. Data are representative of two independent experiments with similar results.
Extended Data Fig.10:
Extended Data Fig.10:. ScRNA-seq analysis of CD4 T cells after mRNA vaccination alone or mucosal booster.
a-c , scRNA-seq UMAP plots (a,b) with percentage of different clusters (c) of BAL cells from mice at day 6 post Ad5-S booster and lung parenchyma CD4 T cells from mice without Ad5-S booster (mRNA + Ad5-S, n = 3; mRNA, n = 3). d, Heatmap of key gene expression in different clusters from scRNA-seq analysis. e, volcano plots of differential expression of genes of CD4+ T cells between indicated groups. f, GOBP enrichment pathways from scRNA-seq analysis.
Extended Data Fig.11:
Extended Data Fig.11:. Molecular signatures of respiratory IL-21+ CD4 T cells after mucosal booster.
a, Represented flow cytometry plot of IL-21 intracellular staining and IL-21-VFP in BAL CD4+CD44+ T cells from mice with Ad5-S booster. b,c, Sorting strategy (b) and post-sorting check (c) of IL-21+ and IL-21 CD4+ T cell in the BAL, lung parenchyma and draining lymph nodes. d,e, Bulk RNA-seq analysis of IL-21+ and IL-21 CD4+ T cells in BAL, lung parenchyma and mLN from IL-21-VFP reporter mice at day 6 post Ad5-S booster (n = 5). Volcano plots of differential expression of genes (c) and Hallmark enrichment analysis (d) between indicated groups.
Extended Data Fig.12:
Extended Data Fig.12:. Optimal mucosal IgA responses are supported by Blimp-1+ Th1 effector cells.
a-f, Prdm1fl/fl and Prdm1fl/fl CD4-Cre mice were immunized with mRNA-S and Ad5-S as previously (Prdm1fl/fl, n = 7; Prdm1fl/fl CD4-Cre, n = 5). Schematic of experimental design (a); Summary of Tfh cells (CXCR5+PD-1+), SARS-CoV-2 RBD-specific GC B cell, IgA+ B cell and plasma cell responses in the draining lymph nodes (b); SARS-CoV-2 S1- or RBD-specific IgA (c,e) and IgG (d,f) antibody responses in the BAL (c,d) and plasma (e,f). b, Unpaired two-sided t-test; Data presented as mean ± s.e.m.
Extended Data Fig.13:
Extended Data Fig.13:. Mucosal IgA+ B cell responses require B cell-intrinsic TGF-β signaling.
a,b, Mixed CD45.1+R26-CreERT2-tdTomato (Ctrl) and CD45.1+CD45.2+R26-CreERT2-tdTomato Tgfbr2fl/fl (Tgfbr2-iKO) BM (1:1) chimeric mice were immunized and treated as indicated (n = 4). Schematic of experimental design (a); Represented flow cytometry plot and summary of B cell percentage of different compartments (b). c-f, C57BL/6 mice were immunized as indicated (Ctrl, n = 5; TGF-β i.n. blockade, n = 4). Schematic of experimental design (c); SARS-CoV-2 S1- or RBD-specific IgA (d) and IgG (e) antibody responses and SARS-CoV-2 RBD-specific IgG positive B cell and plasma cell responses (f) in the BAL. b, Paired two-sided t-test. Data presented as mean ± s.e.m. Data are representative of two independent experiments with similar results.
Extended Data Fig.14:
Extended Data Fig.14:. Lung macrophages and TGF-β assist optimal mucosal IgA production.
a-c, WT and Tgfb1fl/fl Foxp3-Cre mice were immunized with mRNA-S and Ad5-S as previously (WT, n = 4; Tgfb1fl/fl Foxp3-Cre, n = 5). Schematic of experimental design (a); SARS-CoV-2 RBD-specific IgA positive B cell and plasma cell responses (b) and SARS-CoV-2 S1-specific IgA antibody responses (c) in the BAL. d,e, WT and CD169-DTR mice were immunized with mRNA-S and Ad5-S as previously (WT, n = 10; CD169-DTR, n = 10). Schematic of experimental design (d); SARS-CoV-2 RBD-specific IgA or IgG positive B cell and plasma cell responses (e). f-g, C57BL/6 mice were immunized with mRNA-S and Ad5-S as previously (n = 5). BAL CD4+ T, B cells and macrophages were isolated at day 14 for in vitro coculture for 3 days. Schematic of experimental design (f) and IgA secreting cells number in different groups (g). b,c,e, Unpaired two-sided t-test; g, one-way ANOVA with multiple-comparisons test. Data presented as mean ± s.e.m. d,e, Data are pooled from two independent experiments; f,g, data are representative of two independent experiments with similar results.
Extended Data Fig.15:
Extended Data Fig.15:. Targeting lung macrophages promotes optimal mucosal IgA production.
a,b, C57BL/6 mice were immunized with one dose of mRNA-S plus Ad5-S-mCherry (Naïve, n = 5; low volume, n = 4; high volume, n = 5). Represented flow cytometry plot (a) and summary (b) of neutrophiles and monocytes in the nasal tissue at day 2.5 post Ad5-S. c-e, SARS-CoV-2 RBD-specific IgA responses in the BAL and nasal wash (c) and S1- or RBD-specific IgG responses in the BAL (d) and nasal wash (e) from mice immunized with mRNA-S and Ad5-S as previously at day 14 (Naïve, n = 6; low volume, n = 7; high volume, n = 9). ). b-e, One-way ANOVA with multiple-comparisons test. Data presented as mean ± s.e.m. a-e, Data are pooled from two independent experiments.
Extended Data Fig.16:
Extended Data Fig.16:. Model on the mechanism of mucosal IgA production
a, Current intramuscular mRNA vaccination induces relatively weak mucosal immunity, primarily through IgG antibodies. Natural SARS-CoV-2 infection generates moderate mucosal immunity. A combination of vaccination and infection results in stronger mucosal immunity. However, intramuscular vaccination followed by a mucosal booster elicits robust mucosal immunity with superior IgA responses. b, “Two-Step” Model of Mucosal IgA Production: The first step involves intramuscular vaccination, which initiates the development of IgA+ B cells in lymphoid organs, facilitated by Bcl6+ Tfh cells. In the second step, lymphocytes migrate from lymphoid organs to the respiratory mucosa, where IL-21-producing Blimp-1+ Th1 cells and TGF-β-producing lung macrophages cooperatively support an optimal mucosal IgA-secreting cell response, leading to enhanced IgA production to confer optimal mucosal protection.
Fig.1:
Fig.1:. Systemic and respiratory mucosal Ab responses in individuals with SARS-CoV-2 vaccination and infection.
a, Schematic of recruited cohorts and experimental procedures. Figures were created with BioRender. b-g, Levels of SARS-CoV-2 S1 or RBD binding IgG (b-d) or IgA (e-g) in plasma (b,e), BAL (c,f), and nasal wash (d,g) of COVID-19 naïve individuals (n = 12), COVID-19 convalescents (n = 75), COVID-19 vaccinated individuals (n = 5), vaccinated plus infected individuals (n = 14). h-j, Levels of SARS-CoV-2 neutralizing Ab against D614G and Omicron BA.1 strains in plasma (h), BAL (i), and nasal wash (j) of COVID-19 naïve individuals (n = 14 for plasma, n = 12 for BAL and n = 4 for nasal wash), COVID-19 convalescents (n = 72 for plasma and BAL, n = 29 for nasal wash), vaccinated individuals (plasma and BAL, n = 5; nasal wash, n = 3), or vaccinated plus infected individuals (plasma and BAL, n = 14; nasal wash, n =5). Individuals with undocumented COVID-19 infection are indicated as hollow symbols in groups of COVID-19 convalescents and COVID-19 vaccinated plus infected. Enrolled donors’ demographics are provided in Extended table 1. b-j, One-way ANOVA with multiple-comparisons test. Data presented as mean ± s.e.m.
Fig.2:
Fig.2:. Mucosal signatures of hybrid immunity in animal models.
a, Schematic of experimental design. C57BL/6 mice were immunized as indicated (PBS, n = 3; SARS-CoV-2 MA10, n = 4; mRNA-S, n = 5; mRNA-S + MA10, n =5). b,c, An scRNA-seq UMAP plot (b) with percentage of different clusters (c) of BAL cells from mice at day 6 post SARS-CoV-2 MA10 infection or without infection. d, GOBP enrichment pathways of BAL cells from scRNA-seq analysis. e, Enrichment of upregulated pathways in BAL CD4+, CD8+ T and B cells from mRNA-S+ MA10 group versus mRNA-S group. f-i, Represented flow cytometry plot (f,h) and summary (g,i) of SARS-CoV-2 peptide-specific CD4+, CD8+ T cell (f,g) and RBD-specific B cell responses (h,i) in the BAL from different groups. j, SARS-CoV-2 S1-specific IgG and IgA responses in the BAL from different groups. k, SARS-CoV-2-specific neutralizing Ab response against D614G in the BAL from different groups. l, Schematic of experimental design. K18-hACE2 mice were immunized as indicated (PBS, n = 3; SARS-CoV-2 Omicron BA.1, n = 3; mRNA-S, n = 4; mRNA-S + Omicron BA.1, n =7). m, Flow cytometry summary of SARS-CoV-2 RBD-specific B cell responses in the BAL from different groups. n, SARS-CoV-2 S1-specific IgG and IgA responses in the BAL from different groups. g, Two-way ANOVA with multiple-comparisons test; i-k,m,n, one-way ANOVA with multiple-comparisons test. Data presented as mean ± s.e.m. f-k,m,n, Data are representative of two independent experiments with similar results.
Fig.3:
Fig.3:. Comparative analyses of the mucosal protective responses after hybrid immunity and mucosal booster vaccination.
a, Schematic of experimental design. C57BL/6 mice were immunized as indicated (Day 0, n = 3; Day 14, PBS, n = 3; mRNA-S, n = 5; mRNA-S + MA10, n =4; mRNA-S + Ad5-S, n =5; Day 60, PBS, n = 3; mRNA-S, n = 3; mRNA-S + MA10, n =7; mRNA-S + Ad5-S, n =7). b-e, Represented flow cytometry plot (b,d) and summary (c,e) of SARS-CoV-2 peptide-specific CD4+ T subsets, CD8+ T cell (b,c) at day 14 and RBD-specific B cell and plasma cell dynamic responses (d,e) in the BAL from different groups. f, SARS-CoV-2 RBD-specific IgA and IgG positive B cell dynamic responses from different groups. g, SARS-CoV-2 S1-specific IgA and IgG dynamic responses in the BAL from different groups. h, SARS-CoV-2-specific neutralizing Ab response against D614G and Omicron BA.1 in the BAL from different groups. i, Schematic of experimental design. K18-hACE2 mice were immunized as indicated (Day 0, n = 3; Day 14, Omicron BA.1, n = 4; mRNA-S, n = 3; mRNA-S + Omicron BA.1, n =6; mRNA-S + Ad5-Omicron-S, n =6; Day 60, Omicron BA.1, n = 3; mRNA-S, n = 3; mRNA-S + Omicron BA.1, n =7; mRNA-S + Ad5-Omicron-S (BA.1), n =7). j, SARS-CoV-2 S1-specific IgA and IgG antibody dynamic responses in the BAL from different groups. k, Schematic of experimental design. K18-hACE2 mice were immunized with mRNA-S, infected with BA.1 or boosted with Ad5-Omicron S (BA.1) as indicated and then challenged with SARS-CoV-2 Omicron BA2.86. l, Viral titers in the mouse BAL and nasal wash in different groups at 2 days post SARS-CoV-2 BA.2.86 challenge (n = 5 in each group for challenge). c, Two-way ANOVA with multiple-comparisons test; l, one-way ANOVA with multiple-comparisons test. Data presented as mean ± s.e.m. b-h,j, Data are representative of two independent experiments with similar results.
Fig.4:
Fig.4:. Optimal mucosal IgA responses are supported by T-B interactions in situ.
a, C57BL/6 mice were immunized by one dose of mRNA-S plus Ad5-S (n = 10). Represented flow cytometry plot and summary of SARS-CoV-2 RBD-specific IgA and IgG positive B cell percentage and number in the BAL and mLN at day 14 post Ad5-S. b, Correlation analysis between levels of SARS-CoV-2 S1-specific IgA or IgG and SARS-CoV-2 RBD-specific IgA and IgG positive B cell and plasma cells from immunized mice as indicated at day 14 post immunization (mRNA + MA10, n = 9; mRNA + Ad5-S, n =9). c-e, C57BL/6 mice were immunized as indicated (Ctrl, n = 5; CD4 i.n. depletion, n =4). Schematic of experimental design (c); SARS-CoV-2 S1-specific IgA and IgG responses (d) and SARS-CoV-2 RBD-specific IgA positive B cell and plasma cell responses (e) in the BAL. f-h, C57BL/6 mice were immunized as indicated (FTY720 treated ctrl, n = 5; FTY720 treatment plus CD4 i.p. depletion, n =4). Schematic of experimental design (f); SARS-CoV-2 S1-specific IgA and IgG responses (g) and SARS-CoV-2 RBD-specific IgA positive B cell and plasma cell responses (h) in the BAL. i-k, C57BL/6 mice were immunized as indicated (Ctrl, n = 13; ICOSL + CD40L i.n. blockade, n =8; ICOSL + CD40L i.p. blockade, n =4). Schematic of experimental design (i); SARS-CoV-2 S1-specific IgA and IgG responses (j) and SARS-CoV-2 RBD-specific IgA positive B cell and plasma cell responses (k) in the BAL. l-n, C57BL/6 mice were immunized as indicated (n = 5). Schematic of in vitro coculture experimental design (l); Represented flow cytometry plot of B cell and IgA secreting cell responses (m) and SARS-CoV-2 S1-specific IgA responses in supernatant (B cell alone, n=11; B plus T cells, n = 5, B plus T cells with CD40L and ICOSL blockade, n = 11) (n). a, Two-way ANOVA with multiple-comparisons test; b, single linear regression analysis; d,e,g,h, unpaired two-sided t-test; j,k,n, one-way ANOVA with multiple-comparisons test. Data presented as mean ± s.e.m. a,b,j,k, Data are pooled from two independent experiments; d,e,g,h,n, Data are representative of two independent experiments with similar results.
Fig.5:
Fig.5:. IL-21 and Blimp-1+ Th1 effector cells assist mucosal IgA production
a, Level of IL-21 in the BAL from different groups (mRNA-S, n = 5; mRNA-S + MA10, n = 4; mRNA-S + Ad5-S, n = 5) as indicated at day 6 post immunizations. b-d, C57BL/6 mice were immunized as indicated (Ctrl, n = 5; IL-21R i.n. blockade, n = 5). Schematic of experimental design (b); SARS-CoV-2 S1-specific IgA antibody responses (c) and SARS-CoV-2 RBD-specific IgA positive B cell and plasma cell responses (d) in the BAL. e, C57BL/6 mice were immunized with one dose of mRNA-S plus Ad5-S (n = 5). BAL CD4+ T cells and B cells were isolated at day 14 for in vitro coculture for 3 days. Represented flow cytometry plot of IgA secreting cell response and SARS-CoV-2 S1-specific IgA responses in supernatant (B plus T cells, n = 6, B plus T cells with IL-21R blockade, n = 11). f-h, scRNA-seq analysis of BAL and lung parenchyma CD4+ T cells at day 6 post Ad5-S booster and lung parenchyma CD4 T cells without Ad5-S booster from C57BL/6 mice (mRNA + Ad5-S, n = 3; mRNA, n = 3). An UMAP plot of clustering (f); Il21 expression (g), and main Th1- and Tfh-related gene expression in indicated clusters (h). i,j, Bulk RNA-seq analysis of IL-21+ and IL-21 CD4+ T cells in BAL, lung parenchyma and mLN from IL-21-VFP reporter mice at day 6 post Ad5-S booster (n = 5). Heatmap of Tfh- and Th1-related gene expression (i) and GSEA of CXCR5low effector CD4+ T vs CXCR5hi Tfh (GSE16697) in different groups compared to mLN IL-21+ CD4+ T cells (j). k, Represented flow cytometry plot and summary of SARS-CoV-2 peptide-specific IFN-γ and IL-21 positive CD4+ T cells in the BAL from different groups (mRNA-S, n = 5; mRNA-S + MA10, n = 4; mRNA-S + Ad5-S, n = 5) as indicated at day 14. l, Represented flow cytometry plot and summary of level of Blimp-1 expression in BAL CD4+ T cells from mice immunized with one dose of mRNA-S plus Ad5-S at day 14. m, Represented flow cytometry plot and summary of percentage of Blimp-1 and Bcl6 expressions in BAL CD4+ T cells from Blimp-1/Bcl6 dual reporter mice immunized with mRNA-S and Ad5-S as previously at day 14 (n = 3). n-q, Prdm1fl/fl and Prdm1fl/fl CD4-Cre mice were immunized with mRNA-S and Ad5-S as previously (Prdm1fl/fl, n = 7; Prdm1fl/fl CD4-Cre, n = 5). Represented flow cytometry plot (n) and summary (o) of SARS-CoV-2 peptide-specific IFN-γ and IL-21 positive CD4+ T cells in the BAL; SARS-CoV-2 RBD-specific IgA positive B cell, plasma cell (p) and S1-specific IgA antibody responses (q) in the BAL. a,l,m, One-way ANOVA with multiple-comparisons test; c-e,p,q, unpaired two-sided t-test; k,o, two-way ANOVA with multiple-comparisons test. Data presented as mean ± s.e.m. c-e,k,l, Data are representative of two independent experiments with similar results.
Fig.6:
Fig.6:. Lung macrophage and TGF-β assist optimal mucosal IgA production.
a, Level of TGF-β1 in the BAL from different groups (mRNA-S, n = 5; mRNA-S + MA10, n = 4; mRNA-S + Ad5-S, n = 5) as indicated at day 6 post immunizations. b, Represented flow cytometry plot and summary of level of TGFBRII expression in IgA+ B cells in the BAL and IgA+ B and IgG+ B cells in mLN from mice immunized with mRNA-S and Ad5-S as previously at day 14 (n = 4). c-e, Mixed CD45.1+R26-CreERT2-tdTomato (Ctrl) and CD45.1+CD45.2+R26-CreERT2-tdTomato Tgfbr2fl/fl (Tgfbr2-iKO) BM (1:1) chimeric mice were immunized and treated as indicated (n = 4). Schematic of experimental design (c); Represented flow cytometry plot (d) and summary (e) of SARS-CoV-2 RBD-specific IgA positive B cell and plasma cell percentage. f-h, C57BL/6 mice were immunized as indicated (Ctrl, n = 5; TGF-β i.n. blockade, n = 4). Schematic of experimental design (f); SARS-CoV-2 RBD-specific IgA positive B cell, plasma cell (g) and S1-specific IgA antibody responses (h) in the BAL. i, SARS-CoV-2 RBD-specific IgA positive B cell, plasma cell and S1-specific IgA responses in the BAL from indicated mice immunized with mRNA-S and Ad5-S as previously at day 14 (Tgfb1fl/fl, n = 11; Tgfb1fl/fl UBC-CreERT2, n = 5; Tgfb1fl/fl CD4-CreERT2, n = 4; Tgfb1fl/fl LysM-CreERT2, n = 6). j, C57BL/6 mice were immunized with one dose of mRNA-S plus Ad5-S (n = 5). BAL CD4+ T, B cells and macrophages were isolated at day 14 for in vitro coculture for 3 days. SARS-CoV-2 S1-specific IgA responses in supernatant (n = 5 for each group). k, C57BL/6 mice were immunized with Ad5-S-mCherry (Naïve, n = 5; low volume, n = 4; high volume, n = 5). Represented flow cytometry plot and summary of mCherry+ macrophage percentage in the BAL. l, SARS-CoV-2 S1-specific IgA responses in the BAL and nasal wash from mice immunized with mRNA-S and Ad5-S as previously at day 14 (Naïve, n = 6; low volume, n = 7; high volume, n = 9). a,b, i-l, One-way ANOVA with multiple-comparisons test; e, paired two-sided t-test; g,h, unpaired two-sided t-test. Data presented as mean ± s.e.m. b,d-h,j,k, Data are representative of two independent experiments with similar results. i, Data are pooled from three independent experiments.

References

    1. Sadarangani M., Marchant A. & Kollmann T. R. Immunological mechanisms of vaccine-induced protection against COVID-19 in humans. Nat Rev Immunol 21, 475–484, doi: 10.1038/s41577-021-00578-z (2021). - DOI - PMC - PubMed
    1. Bladh O. et al. Mucosal immune responses following a fourth SARS-CoV-2 vaccine dose. Lancet Microbe 4, e488, doi: 10.1016/S2666-5247(23)00102-7 (2023). - DOI - PMC - PubMed
    1. Tang J. et al. Respiratory mucosal immunity against SARS-CoV-2 following mRNA vaccination. Sci Immunol, eadd4853, doi: 10.1126/sciimmunol.add4853 (2022). - DOI - PMC - PubMed
    1. Mao T. et al. Unadjuvanted intranasal spike vaccine elicits protective mucosal immunity against sarbecoviruses. Science 378, eabo2523, doi: 10.1126/science.abo2523 (2022). - DOI - PMC - PubMed
    1. Becerra X. & Jha A. Project NextGen - Defeating SARS-CoV-2 and Preparing for the Next Pandemic. N Engl J Med 389, 773–775, doi: 10.1056/NEJMp2307867 (2023). - DOI - PubMed

Publication types