[Preprint]. 2025 Sep 26:2025.09.24.678351.
doi: 10.1101/2025.09.24.678351.

Targeting RAD52 overcomes PARP inhibitor resistance in preclinical Brca2-deficient ovarian cancer model

Affiliations

Targeting RAD52 overcomes PARP inhibitor resistance in preclinical Brca2-deficient ovarian cancer model

Yukihide Ota et al. bioRxiv. .

Abstract

BRCA-mutated ovarian cancer commonly develops resistance to poly (ADP-ribose) polymerase (PARP) inhibitors. Here, we investigated the DNA repair protein RAD52 as a potential target to overcome resistance. In analysis of The Cancer Genome Atlas datasets and immunohistochemistry of tissue microarrays, elevated RAD52 expression correlated with poor overall survival in patients with high-grade serous ovarian cancers. We tested two PARP inhibitor-resistant Brca2-deficient mouse ovarian cancer models, ID8-OR and HGS2-OR. HGS2-OR cells had higher RAD52 expression than parental lines. Rad52 knockout or knockdown restored PARP inhibitor sensitivity in both models. In syngeneic mice, ID8-OR cells in which Rad52 was knocked out yielded lower tumor burden and longer overall survival than control cells. Rad52 depletion impaired single-strand annealing and homologous recombination and led to accumulation of DNA double-strand breaks after PARP inhibitor treatment. RNA sequencing demonstrated that PARP inhibitor treatment induced Polq expression in Brca2- and Rad52-deficient cells, suggesting a switch to microhomology-mediated end joining. Finally, the RAD52 inhibitor D-I03 synergized with a PARP inhibitor to reduce cell viability and tumor burden and prolong survival. Collectively, our findings establish RAD52 as a promising therapeutic target to overcome PARP inhibitor resistance in BRCA2-mutated ovarian cancer and offer mechanistic insights to inform future clinical strategies.


Conflict of interest statement

Competing interests The authors declare no competing interests.

Figures

Figure 1.
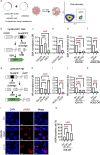
Figure 1.. RAD52 is associated with poor prognosis in serous ovarian cancer and is upregulated in a BRCA2-deficient, PARP inhibitor–resistant cell line.
(a) Representative immunohistochemical images of RAD52 staining in the tissue microarray. (b) Kaplan-Meier analysis of OS of patients with high grade serous ovarian cancer whose tumors were represented in the tissue microarray dichotomized as high (H-score ≥ 168) or low (H-score < 168) RAD52 protein expression. The log-rank test was used to analyze survival at 4 years after diagnosis. (c) Kaplan-Meier analysis of overall survival (OS) of patients from the The Cancer Genome Atlas database with serous ovarian cancer with TP53 mutations and high or low RAD52 mRNA expression. The log-rank test was used to analyzed survival at 4 years after diagnosis. (d) Viability assays comparing Brca2-deficient parental (PB) and olaparib-resistant (OR) ovarian cancer cells treated with olaparib for 5 days. (e) Brca2 mutation status was evaluated by next-generation sequencing. Exon 3 was analyzed in ID8-PB and ID8-OR cells, and exon 11 in HGS2 and HGS2-OR cells. (f) Western blots of RAD52 protein expression in Brca2-deficient parental and OR cells. (g, h) Quantification of RAD52 (g) protein and (h) mRNA normalized to β-actin and shown relative to the amount in parental cells. Data show mean ± standard deviation of at least three independent experiments, with individual dots for each replicate. Statistical significance was assessed by two-sided Student’s t-tests.
Figure 2.
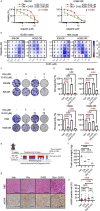
Figure 2.. Genetic depletion of Rad52 restores PARP inhibitor sensitivity in Brca2-deficient, PARP inhibitor–resistant ovarian cancer cells.
(a) Western blot validation of Rad52 knockout in ID8-OR cells and knockdown in HGS2-OR cells. (b) qRT-PCR of Rad52 mRNA normalized to Actb. One of the primers was designed to span the CRISPR/Cas9 cleavage site. (c) Cell viability assay comparing Rad52-depleted cells with Scr control cells treated with a range of 0–20 μM olaparib for 5 days. (d) Clonogenicity assay following 8-day treatment with 5 μM olaparib or vehicle. (e) Quantification of clonogenicity assay from panel (d). Data show mean ± standard deviation of at least three independent experiments, with individual dots for each replicate. Statistical significance was assessed by two-sided Student’s t-tests for two-group comparisons and one-way ANOVA followed by Šídák’s multiple comparisons test for comparisons among three groups. Veh, vehicle; Ola, olaparib.
Figure 3.
Figure 3.. Rad52 depletion suppresses tumor growth in a mouse model of Brca2-deficient ovarian cancer.
(a) Schematic illustrating the ID8-OR xenograft mouse model experimental design. (b) Representative macroscopic images of mice in the four groups. The dotted areas indicate disseminated nodules in the peritoneal cavity. Green arrows indicate the omentum. (c) Total tumor weight excluding the omentum. Mean ± standard deviation: Scr_Veh 132.4 ± 76.1 mg, Scr_Ola 131.6 ± 68.1 mg, KO#1_Veh 4.4 ± 4.0 mg, KO#1_Ola 9.5 ± 7.0 mg. (d) Weight of the omentum (including the pancreas and surrounding adipose tissue). Scr_Veh 125.0 ± 67.1 mg, Scr-Ola 141.0 ± 57.1 mg, KO#1-Veh 41.5 ± 19.5 mg, KO#1-Ola 37.0 ± 22.3 mg. (e) Number of intraperitoneal tumor nodules (≥1 mm in diameter). Scr_Veh 60.3 ± 35.4, Scr_Ola 53.0 ± 34.7, KO#1_Veh 3.4 ± 2.9, KO#1_Ola 1.8 ± 1.6. (f) Volume of ascites. Scr_Veh 2.1 ± 2.0 mL, Scr_Ola 1.0 ± 0.9 mL, KO#1_Veh 0 ± 0 mL, KO#1_Ola 0 ± 0 mL. For panels (c)–(f), n = 8 mice per group. (g) Representative H&E and immunohistochemical staining for γH2AX. Scale bar, 100 μm. (h) Quantification of γH2AX-positive nuclei in intraperitoneal tumor tissues. P-values determined by one-way ANOVA followed by Šídák’s multiple comparisons test. (i) Kaplan–Meier survival curves. A log-rank test was initially conducted across all four groups, followed by pairwise comparisons between selected groups. To account for multiple comparisons (three in total), the significance threshold was adjusted to p < 0.0167 using Bonferroni correction (0.05/3). Median survival (days): Scr_Veh 49, Scr-Ola 46.5, KO#1-Veh 67, KO#1-Ola Not reached.
Figure 4.
Figure 4.. RAD52 promotes SSA and HR repair activity and limits DNA damage accumulation in PARP inhibitor-resistant cells.
(a) Reporter plasmids used in GFP-based assays to measure single-strand annealing (SSA) and homologous recombination (HR) activity. (a) Schematic illustration of the GFP-based reporter assays. Reporter plasmids were co-transfected with pCBASceI, which encodes the I-SceI endonuclease. Successful repair of I-SceI–induced double-strand breaks restore GFP expression, which can be detected by flow cytometry 24–48 hours after transfection. (b) hprtSA-GFP construct used in GFP-based assays to measure single-strand annealing (SSA) (c) SSA activity in ID8-OR (Trp53−/−, Brca2−/−, olaparib-resistant), ID8-PB (Trp53−/−, Brca2−/−), and ID8-P (Trp53−/−, Brca2+/+) cells, normalized to ID8-OR. (d) SSA activity in HGS2-OR (Trp53−/−, Brca2−/−, Pten−/−, olaparib-resistant) and HGS2 (Trp53−/−, Brca2−/−, Pten−/−) cells, normalized to HGS2-OR. (e) SSA activity in ID8-Scr, ID8-Rad52KO#1, and ID8-Rad52KO#2, normalized to ID8-Scr. (f) SSA activity in HGS2-Scr, HGS2-Rad52KD#1, normalized to HGS2-Scr. (g) pDR-GFP construct used in GFP-based assays to measure homologous recombination (HR). (h) HR activity in ID8-OR, ID8-PB, and ID8-P cells, normalized to ID8-OR. (i) HR activity in HGS2-OR and HGS2 cells, normalized to HGS2-OR. (j) HR activity in ID8-Scr, ID8-Rad52KO#1, and ID8-Rad52KO#2, normalized to ID8-Scr. (k) SSA activity in HGS2-Scr, HGS2-Rad52KD#1, normalized to HGS2-Scr. (l) Representative immunofluorescence images and (m) quantitation of γH2AX foci. Scale bar, 10 μm. Data show mean ± standard deviation of at least three independent experiments, with individual dots for each replicate. P-values were determined by two-sided Student’s t-test for two-group comparisons and one-way ANOVA with Šídák’s multiple comparisons test for comparisons among three or more groups.
Figure 5.
Figure 5.. RNA-seq reveals Polq upregulation and aberrant activation of the G2M checkpoint and E2F target pathways in Rad52-deficient ID8-OR cells treated with olaparib.
(a) Schematic illustration of the cell lines and treatment groups. (b) Principal component analysis of the four experimental groups. (c) Volcano plot shows differentially expressed genes between ID8-KO#1 and Scr cells treated with olaparib. Differentially expressed DNA repair-related genes are labeled. (d) Heatmap showing Z-score expression values of DNA repair–related genes, ranked in descending order based on expression in Scr cells treated with olaparib. Genes involved in specific pathways are labeled. (e) Z-score of Polq expression in Scr and ID8-KO#1 cells treated with olaparib or vehicle. (f) qRT-PCR analysis of Polq expression, normalized to b-actin and presented relative to the expression in Scr cells treated with olaparib. (g, h) Gene set enrichment analysis of Hallmark pathways between ID8-KO#1 and Scr control treated with (g) vehicle or (h) 1 μM olaparib for 24 hours. Enrichment bar plot shows normalized enrichment scores. Pathways with adjusted p-value <0.05 were considered significant. (i) Enrichment plots of G2M checkpoint and E2F targets pathways. (j) Heatmap shows top 30 leading-edge genes of G2M checkpoint and E2F Targets pathways with the highest log fold-change values in Rad52-KO#1 versus Scr control cells treated with olaparib. (k) The dot plot shows the Z-scores of Ccnd1, Ccna2, Ccne1, Pole, Smc4, and Cdc6 (red arrows in j) in the four conditions (ID8-Scr and ID8-Rad52KO#1 cells treated with vehicle or olaparib). Data are based on RNA-seq analysis. Bars indicate the mean of three independent experiments, with individual dots representing each replicate.
Figure 6.
Figure 6.. Selective RAD52 inhibitor restores PARP inhibitor sensitivity in Brca2-deficient, PARP inhibitor–resistant ovarian cancer cells in vitro and in vivo.
(a) Viability assay of cells treated with olaparib alone or in combination with D-I03 for 5 days. (b) BLISS and HSA synergy map based on the data in (a). (c) Clonogenicity assay of ID8-PB, ID8-OR, HGS2, and HGS2-OR cells treated with the indicated concentrations of olaparib and D-I03. (d) Quantification of clonogenic assay results. (e) Schematic illustrating the ID8-OR xenograft mouse model. (f) Tumor weights at the end of treatment. (g) Representative images of H&E, immunohistochemistry of γH2AX. Scale bar, 100 μm. (h) Quantification of γH2AX-positive nuclei in intraperitoneal tumor tissues. Data show mean ± standard deviation of at least three independent experiments, with individual dots for each replicate. P-values were determined by two-sided Student’s t-tests for two-group comparisons and one-way ANOVA followed by Šídák’s multiple comparisons test for comparisons among three groups.

References

    1. Siegel R. L., Kratzer T. B., Giaquinto A. N., Sung H. & Jemal A. Cancer statistics, 2025. CA Cancer J Clin 75, 10–45 (2025). - PMC - PubMed
    1. Konstantinopoulos P. A., Ceccaldi R., Shapiro G. I. & D’Andrea A. D. Homologous recombination deficiency: exploiting the fundamental vulnerability of ovarian cancer. Cancer Discov 5, 1137–1154 (2015). - PMC - PubMed
    1. Gilks C. B. Subclassification of ovarian surface epithelial tumors based on correlation of histologic and molecular pathologic data. Int J Gynecol Pathol 23, 200–205 (2004). - PubMed
    1. Seidman JD, H.-S I., Haiba M, Boice CR, Kurman RJ, Ronnett BM. The histologic type and stage distribution of ovarian carcinomas of surface epithelial origin. Int J Gynecol Pathol 23, 41–44 (2004). - PubMed
    1. Coffman L. G., Orellana T. J., Liu T., Frisbie L. G., Normolle D., Griffith K. et al. Phase I trial of ribociclib with platinum chemotherapy in ovarian cancer. JCI Insight 7, e160573 (2022). - PMC - PubMed

Publication types