. 2025 Sep 19:4:192.
doi: 10.12688/openreseurope.18245.2. eCollection 2024.

Refined and benchmarked homemade media for cost-effective, weekend-free human pluripotent stem cell culture

Affiliations

Refined and benchmarked homemade media for cost-effective, weekend-free human pluripotent stem cell culture

Lukasz Truszkowski et al. Open Res Eur. .

Abstract

Background: Cost-effective, practical, and reproducible culture of human pluripotent stem cells (hPSCs) is required for basic and translational research. Basal 8 (B8) has emerged as a cost-effective solution for weekend-free and chemically-defined hPSC culture. However, the requirement to home-produce some recombinant growth factors for B8 can hinder access and reproducibility. Moreover, we found the published B8 formulation suboptimal in widely-used normoxic hPSC culture. Lastly, the performance of B8 in functional applications such as genome editing or organoid differentiation required systematic evaluation.

Methods: We formulated B8 with commercially available, growth factors and adjusted its composition to support normoxic culture of WTC11 human induced pluripotent stem cell line. We compared this formulation (B8+) with commercial Essential 8 (cE8) and a home-made, weekend-free E8 formulation (hE8). We measured pluripotency marker expression and cell cycle by flow cytometry, and investigated the transcriptional profiles by bulk and single-cell RNA sequencing. We further assessed genomic stability, genome editing efficiency, single-cell cloning, and differentiation in both monolayer and organoids. Finally, we validated key findings using male (H1) and female (H9) human embryonic stem cells.

Results: hE8 performed comparably to cE8 across most functional assays and cell lines. In contrast, cells in B8+ displayed higher NANOG expression and improved genome editing efficiency. At the same time, B8+ led to gene expression changes indicative of marked lineage priming, reflected in altered morphology and differential response to some differentiation protocols. Both weekend-free media resulted in a modest transcriptional shift towards a less metabolically active state, consistent with intermittent media starvation.

Conclusions: Homemade weekend-free media can provide a cost-effective alternative to commercial formulations. hE8, integrating some features of B8 while resembling cE8, emerges as a robust and practical option with limited compromises. B8+, though advantageous in some contexts, warrants caution due to lineage priming effects that may impact differentiation outcomes.

Keywords: hiPSC; pluripotency; culture media; thermostable FGF2; TGF beta.


Conflict of interest statement

Competing interests: H.B. and L.F. are employees of Qkine and C.E. was the CEO of Qkine for most of the study. The rest of the authors declare no competing interests.

Figures

Figure 1.
Figure 1.. Evaluation of TGF-β and FGF2 sources and concentrations in B8 media.
( AB) Variants of FGF2-G3 ( A) or TGF-β ( B) activity assay using a serum response element luciferase reporter assay in transfected HEK293T cells. Medium pre-incubated in 37 °C for 2 days was compared to the fresh medium. Firefly luciferase activity was normalised to control Renilla luciferase activity. n = 3 experiments. ( C) Schematic of B8-based media formulations with different types of FGF2 (standard versus thermostable [G3]; full length versus truncated [t]) and TGF-β-superfamily growth factor. ( DE) Representative flow cytometry data of OCT4 and NANOG expression in hiPSCs grown in media described in panel C ( D; no data could be acquired for condition 3), or in media with 1 ng/mL TGF-β3 and the indicated concentrations of the truncated or full-length FGF2-G3 ( E).
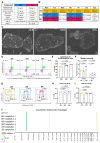
Figure 2.
Figure 2.. Characterization of hiPSCs adapted to weekend-free media.
( A) Final concentrations of components in the supplements for two weekend-free media compositions (both based on DMEM/F12). ( B) Weekly schedule of hiPSC culture in three different media. Days highlighted in colour involve media changes. ( C) Phase-contrast images of representative hiPSC colonies 72 h after passage. Scale bar: 200 µm. ( D) Representative flow cytometry analyses of OCT4 and NANOG expression in hiPSCs grown in different media. ( EF) Flow cytometry quantifications of the percentage of NANOG + OCT4 + cells ( E) and the normalised median fluorescence intensity value of NANOG and OCT4 ( F). Median values were normalised through division by the median intensity value of the respective isotype control. n = 3 independent adaptations of the cells into the media. Statistical analyses by one-way ANOVA followed by Dunnet’s multiple comparisons test. ( G) Representative flow cytometry cell cycle analyses in EdU-treated cells stained for DNA content. ( HI) Flow cytometry quantifications of the percentage of cells in G1 ( H) or S ( I) phase. Circle and triangle represent 2 independent media adaptations, while the filled/empty symbols represent 2 repetitions of the experiment. Statistical analyses by mixed effects model followed by Dunnet’s multiple comparisons test. ( J) Copy number variation (CNV) analysis of cells after 20 passages in the media. Colored bands represent the number of copies of detected CNVs (or loss of heterogeneity - LOH). n = 2 independent media adaptations.
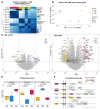
Figure 3.
Figure 3.. Effects of weekend-free media on gene expression.
( AB) Pearson correlation ( A) and Principal Component Analysis (PCA; B) based on the expression of the 1000 most variable genes in bulk RNA-seq measurements of hiPSCs adapted to the indicated media. n =3 independent adaptations of the cells into the media. ( C) Volcano plots showing differentially expressed genes in cE8, hE8 or B8+ in comparison to cE8. Significantly different genes are highlighted in color. ( D) Changes in gene expression of key pluripotency genes, measured as a Z-scores of TPM normalised counts. P-values are calculated by linear model fitting and are adjusted for Benjamini-Hochberg false discovery rate. ( E) Schematic of genes involved in primed pluripotency signalling (according to KEGG pathways); those significantly upregulated in cE8 or B8+ are coloured in shades of yellow or red, respectively.
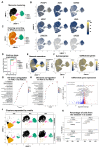
Figure 4.
Figure 4.. Heterogeneity in hiPSCs adapted to weekend-free media.
( A) Aggregated Monocle clustering of single cell RNA-seq data from two individual media adaptations of hiPSCs to cE8, hE8 and B8+. ( B) Expression levels of representative lineage markers. ( C) Cell labeling according to previously established subpopulations of hiPSCs . ( D) Cumulative frequency distribution of cells from each cluster based on the human embryo developmental day they correspond most closely to . ( E) Expression of transcriptional signature of nascent mesoderm across the clusters. ( F) Scores based on the expression of genes characteristic for S or G2/M phase of the cell cycle. ( G- H) Gene Ontology terms enriched in genes overexpressed in iPSC-1 ( G) versus iPSC-2 ( H) clusters. ( I) Volcano plot showing differentially expressed genes in iPSC-1 versus iPSC-2 clusters Significantly different genes are highlighted in color. ( J) Cluster assignment of hiPSCs adapted to weekend-free media. ( K) Proportion of cells from the particular media assigned to the cluster. Statistical analysis by one-way ANOVA followed by a Dunnet’s multiple comparison’s test.
Figure 5.
Figure 5.. Applications of hiPSCs adapted to weekend-free media.
( A) Representative images of GFP-positive iPSC colonies after puromycin selection of AAVS1 genome-edited cells. ( B) Quantification of the positive colonies. Circles and triangles represent 2 independent media adaptations, while the different types of symbol filling represents 3 repetitions of the experiment. Statistical analyses by mixed effects model followed by Dunnet’s multiple comparisons test. ( C) Quantification of hiPSC clonality after single cell sorting into 96-well plate. n = 2 media adaptations. ( D) Z-scores of gene expression levels in hiPSCs adapted to weekend-free media and the same cells differentiated into three germ layers, as measured by RT-qPCR. n = 2 media adaptations. ( E) Exemplary flow cytometry analyses of TNNT2 expression in hiPSCs successfully differentiated towards cardiomyocytes in monolayer ( F) Exemplary brightfield images of organoids derived from hiPSCs. Scale bar: 500 µm. ( G) Exemplary flow cytometry analyses of TNNT2 expression in hiPSCs successfully differentiated towards cardiomyocytes in organoids. ( HI) Flow cytometry quantifications of the percentage of TNNT2-positive cells ( H) and the normalised median TNNT2 value ( I) in cardiac organoid differentiations. Median values were normalised through division by the median intensity value of the respective isotype control. Circles and triangles represent 2 independent media adaptations, while the different types of symbol filling represents 4 repetitions of the experiment. Statistical analyses by mixed effects model followed by Dunnet’s multiple comparisons test.
Figure 6.
Figure 6.. Differentiation of hiPSCs into colon organoids.
( A) Brightfield images of budding endodermal layers derived from hiPSCs adapted to different media. ( B- C) Quantifications of number ( B) and the roundness ( C) of organoids extracted from the monolayers at day 13 of differentiation. ( D) Images of whole-mount immunostainings of mature colon organoids. Scale bar: 100 µm.
Figure 7.
Figure 7.. Adaptation of hESC lines to weekend-free media.
( A) Flow cytometry analyses of OCT4 and NANOG expression in H1 hESCs grown in different media. The results are shown for two independent media adaptations. ( B) Flow cytometry analysis of CD43 and CD34 expression of H1 hESCs differentiated towards primitive hematopoietic stem cells. ( C) Flow cytometry analysis of OCT4 and NANOG expression in H9 hESCs grown in different media. ( D) Immunostainings of sectioned human cortical organoids derived from H9 hESCs. Scale bar: 50 µm.

References

    1. Siller R, Greenhough S, Park IH, et al. : Modelling human disease with Pluripotent Stem Cells. Curr Gene Ther. 2013;13(2):99–110. 10.2174/1566523211313020004 - DOI - PMC - PubMed
    1. Ludwig T, Thomson JA: Defined, feeder-independent medium for human Embryonic Stem cell culture. Curr Protoc Stem Cell Biol. 2007;2:1C.2.1–1C.2.16, Chapter 1:Unit 1C.2. 10.1002/9780470151808.sc01c02s2 - DOI - PubMed
    1. Chen G, Gulbranson DR, Hou Z, et al. : Chemically defined conditions for human iPSC derivation and culture. Nat Methods. 2011;8(5):424–429. 10.1038/nmeth.1593 - DOI - PMC - PubMed
    1. Kuo HH, Gao X, DeKeyser JM, et al. : Negligible-cost and weekend-free chemically defined human iPSC culture. Stem Cell Reports. 2020;14(2):256–270. 10.1016/j.stemcr.2019.12.007 - DOI - PMC - PubMed
    1. Lyra-Leite DM, Fonoudi H, Gharib M, et al. : An updated protocol for the cost-effective and weekend-free culture of human induced Pluripotent Stem Cells. STAR Protoc. 2021;2(1): 100213. 10.1016/j.xpro.2020.100213 - DOI - PMC - PubMed

LinkOut - more resources