Evaluating Climate Change Effects on Swan Habitats Within China: Adaptive Strategies for Sustainable Conservation
- PMID: 41041402
- PMCID: PMC12486193
- DOI: 10.1002/ece3.72238
Evaluating Climate Change Effects on Swan Habitats Within China: Adaptive Strategies for Sustainable Conservation
Abstract
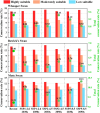
Under the combined pressures of global climate change and human activities, swan habitats in China are facing severe threats, posing direct challenges to the effectiveness of existing protected areas. However, the dynamic changes in the distribution of swan habitats and conservation coverage under climate change remain insufficiently explored. In this study, we focused on three widely distributed swan species in China-Cygnus cygnus (Whooper Swan), Cygnus columbianus (Bewick's Swan), and Cygnus olor (Mute Swan). Using the maximum entropy (MaxEnt) model, we projected the spatial distribution patterns of their habitats and the trends in conservation rates under recent period (2001-2020) and future periods (2021-2040 and 2041-2060) across three Shared Socioeconomic Pathways (SSP1-2.6, SSP2-4.5, and SSP5-8.5). The results indicated that the MaxEnt model performed well, with mean values of training and testing area under the receiver operating characteristic curve (AUC) of 0.966 and 0.956, respectively, and a mean true skill statistic (TSS) of 0.833 across all periods. Slope, NDVI, proximity to water, and isothermality (Bio3) were identified as the key environmental variables jointly influencing the distribution of the three swan species. During the recent period, the total suitable habitat areas of the three swan species were 44.89 × 10⁴, 54.18 × 10⁴, and 48.33 × 10⁴ km2, respectively. Under future scenarios, overall habitat ranges remained relatively stable, but the suitability structure shifted, with low suitability habitats showing greater fluctuations. In terms of conservation coverage, the overall conservation rate of suitable habitats for all three species remained below 11%. Coverage of highly suitable habitats was higher than that of moderately and low suitable habitats, but protection gaps persisted, especially for Whooper Swan and Bewick's Swan. These findings highlight significant mismatches between swan habitats and reserve networks and provide a scientific basis for optimizing conservation planning and adaptive management under climate change.
Keywords: climate change; habitat suitability; maximum entropy model; protected area; swans.
© 2025 The Author(s). Ecology and Evolution published by British Ecological Society and John Wiley & Sons Ltd.
Conflict of interest statement
The authors declare no conflicts of interest.
Figures


References
-
- Abrahms, B. , Carter N. H., Clark‐Wolf T. J., et al. 2023. “Climate Change as a Global Amplifier of Human–Wildlife Conflict.” Nature Climate Change 13: 224–234. 10.1038/s41558-023-01608-5. - DOI
-
- Allouche, O. , Tsoar A., and Kadmon R.. 2006. “Assessing the Accuracy of Species Distribution Models: Prevalence, Kappa and the True Skill Statistic (TSS).” Journal of Applied Ecology 43: 1223–1232. 10.1111/j.1365-2664.2006.01214.x. - DOI
-
- Antão, L. H. , Weigel B., Strona G., et al. 2022. “Climate Change Reshuffles Northern Species Within Their Niches.” Nature Climate Change 12: 587–592. 10.1038/s41558-022-01381-x. - DOI
-
- Ao, P. , Wang X., Meng F., et al. 2020. “Migration Routes and Conservation Status of the Whooper Swan Cygnus cygnus in East Asia.” Wild 6: 43–72.
LinkOut - more resources
Full Text Sources

