[Preprint]. 2025 Sep 26:rs.3.rs-7563799.
doi: 10.21203/rs.3.rs-7563799/v1.

RPS19 and RPL5 Haploinsufficient Models Reveal Divergent Ribosomal Subunit Controls of Fetal Hematopoiesis

Affiliations

RPS19 and RPL5 Haploinsufficient Models Reveal Divergent Ribosomal Subunit Controls of Fetal Hematopoiesis

Lionel Blanc et al. Res Sq. .

Abstract

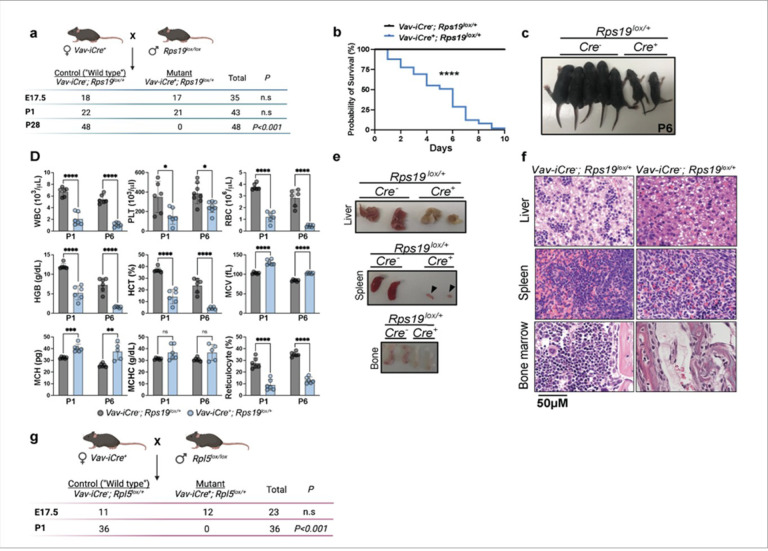
Diamond Blackfan anemia syndrome (DBAS) is a congenital ribosomopathy caused by haploinsufficiency of ribosomal proteins (RPs), but how RP stoichiometry and activity regulates erythroid development remains enigmatic. Using novel in vivo models, we uncover strikingly divergent functions for the small and large ribosomal subunit proteins RPS19 and RPL5 in fetal hematopoiesis. While RPL5 haploinsufficiency causes hematopoietic stem and progenitor cell (HSPC) accumulation and prenatal lethality via p53-mediated ferroptosis of mature erythroid progenitors, RPS19 haploinsufficiency leads to HSPC depletion and impaired erythroid expansion through p53-dependent apoptosis. The latter is accompanied by translational and transcriptional dysregulation, including the upregulation of RUNX1, which is also observed in RPS- haploinsufficient DBAS patients. Importantly, Runx1 deletion in RPS19-haploinsufficient mice partially rescues HSPC numbers. These findings reveal subunit-specific RP functions in controlling fetal hematopoiesis and demonstrate how imbalanced RP stoichiometry disrupts developmental programs, providing crucial mechanistic insights into DBAS pathogenesis and the basis for its clinical heterogeneity.


Conflict of interest statement

DECLARATION OF INTERESTS The authors declare no competing interests.

Figures

Figure 1
Figure 1
Deletion of one copy of Rps19 or Rpl5 leads to severe hematopoietic defects at birth. (a) Genotype counts from Rps19lox/+ intercrossing. (b) Survival curves from Rps19lox/+ mice. (c) Photos of control (Cre) and mutant (Cre+) Rps19lox/+ 6 days after birth (P6). (d) Complete blood counts at P1 and P6. Upper panel: white blood cells (WBC), platelets (PLT), red blood cells (RBC). Middle panel: hemoglobin (HGB), hematocrit (HCT), mean corpuscular volume (MCV). Lower panel: mean corpuscular hemoglobin (MCH), mean corpuscular hemoglobin concentration (MCHC), reticulocytes. (e) Images of the liver, spleen and bone marrow at P6 in control and mutant Rps19lox/+ at P6. The arrow denotes the mutant spleen. (f) Light microscopy images (hematoxylin and eosin) highlighting the architecture and cellular composition of the same hematopoietic organs in control and mutant Rps19lox/+ mice at P6. (g) Genotype counts from Rpl5lox/+ mice. All data are presented as mean ± standard deviation (n.s.: not significant, *p<0.05, **p<0.01, ***p<0.001, ****p<0.0001).
Figure 2
Figure 2
Deletion of one allele of Rps19 or Rpl5 leads to divergent effects on the hematopoietic stem and progenitor cell (HSPC) compartment during fetal hematopoiesis. (a) Images of E13.5 (upper) and E17.5 (lower) control and Rps19lox/+ embryos. (b) Fetal liver (FL) cellularity and Ter119+ counts in E13.5 (upper) and E17.5 (lower) control and Rps19lox/+ embryos. (c) Gating strategy to assess erythropoiesis in the FL. (d) Quantification of cells in S0 and S3 in E13.5 control, and Rps19lox/+ embryos expressed as a fold change relative to control. (e) Quantification of cells in S0 and S3 in E17.5 control, and Rps19lox/+ embryos expressed as a fold change relative to control. (f) Images of E13.5 (upper) and E17.5 (lower) control and Rpl5lox/+ embryos. (g) FL cellularity and Ter119+ counts in E13.5 (upper) and E17.5 (lower) control and Rpl5lox/+embryos. (h) Quantification of cells in S0 and S3 in E13.5 control, and Rpl5lox/+ embryos expressed as a fold change relative to control. (i) Quantification of cells in S0 and S3 in E17.5 control, and Rpl5lox/+ embryos expressed as a fold change relative to control. (j) Schematic representation of the HSPC populations used in the study. (k) Gating strategy to assess early hematopoiesis in the FL. (l) Quantification of the different HSPC populations in E13.5 and E17.5 control and Rps19lox/+ embryos expressed as a fold change relative to control. (m) Quantification of the different HSPC populations in E13.5 and E17.5 control and Rpl5lox/+ embryos expressed as a fold change relative to control. (n) Representative images of colony-forming assays performed in E13.5 control, Rps19lox/+ and Rpl5lox/+ embryos. BFU-E: burst-forming unit-erythroid, CFU-GM: colony-forming unit- granulocyte/macrophage, CFU-GEMM:colony-forming unit-granulocyte, erythrocyte, monocyte and macrophage. (o) Quantification of colonies obtained from E13.5 control, Rps19lox/+ and Rpl5lox/+ embryos. All data are presented as mean ± standard deviation (*p<0.05, **p<0.01, ***p<0.001, ****p<0.0001).
Figure 3
Figure 3
Impaired ribosome biogenesis leads to increased translation in HSPC. (a) Polysome profiles from ckit+ and Ter119+ cell populations in E15.5 control, Rps19lox/+ or Rpl5lox/+ embryos. (b) Quantification of the 40S and 60S ribosomal subunits, monosomes (80S) and polysomes expressed as ratio from ckit+ and Ter119+ cell populations in E15.5 control, Rps19lox/+ or Rpl5lox/+ embryos. (c) Quantification of global translation of LSK and Ter119+ populations as measured by OPP in E13.5 control, Rps19lox/+ or Rpl5lox/+ embryos. (d) Schematics of the main initiation and elongation factors involved in eukaryotic translation. (e) Western blot analysis of regulators of translation in FL-derived ckit+ cells from E15.5 control versus Rps19lox/+ embryos. (f) Western blot analysis of regulators of translation in FL-derived ckit+ cells from E15.5 control versus Rpl5lox/+ embryos. (g) Quantification of the western blots for the regulators of translation in FL-derived ckit+ cells from E15.5 control versus Rps19lox/+ embryos. (h) Quantification of the western blots for the regulators of translation in FL-derived ckit+ cells from E15.5 control versus Rpl5lox/+ embryos. (i) Differential Expression (DE) analyses on the whole cytoplasmic (CYTO) lysate (transcription) and polysomal (POLY) fractions (translation) from Ter119+ cells in E15.5 control, Rps19lox/+ or Rpl5lox/+ embryos. (j) Differential Expression (DE) analyses on the whole cytoplasmic (CYTO) lysate (transcription) and polysomal (POLY) fractions (translation) from cKit+ HSPCs in E15.5 control, Rps19lox/+ embryos. (k) Quantification of genes up or down regulated at the transcriptional and/or translational level in cKit+ and Ter119+ populations at E15.5. % of total is shown, with absolute number of differential genes in parentheses. All data are presented as mean ± standard deviation (*p<0.05, **p<0.01, ***p<0.001, ****p<0.0001).
Figure 4
Figure 4
scRNAseq analyses unravel global transcriptional defects in Rps19lox/+ mice. (a) Experimental design for the scRNAseq (10x Genomics) that was performed on total fetal liver cells from E13.5 embryos. (b) scRNA-seq UMAP of integrated FL from control and Rps19lox/+ and Rpl5lox/+ cells with clusters identified by marker genes. (c) Concordance analysis of GSEA pathways between Rps19lox/+ and Rpl5lox/+ models in HSPC, EP and ProE. (d) List of overlapped significantly enriched pathways (FDR < 0.05) highlighted in red in plot in (c). (e) Scatterplots depicting differential expression patterns of the most significantly altered genes between the Rps19lox/+ and Rpl5lox/+ mouse models in HSPC, EP and ProE.
Figure 5
Figure 5
G1 accumulation and p53 activation lead to distinct mechanisms of hematopoietic cell death in Rps19 and Rpl5 haploinsufficiency. (a) Experimental design of EdU incorporation in FL cells and cell cycle analysis. (b) G1, S and G2/M phase distribution in LSK and Ter119+ populations in E13.5 control, mutant Rps19lox/+ or mutant Rpl5lox/+ embryos. (c) Quantification of the cell cycle speed by measuring the S phase (EdU+) MFI among the LSK and Ter119+ populations in E13.5 control, Rps19lox/+ or Rpl5lox/+ embryos. (d) Expression levels of Trp53 in cKit+ and Ter119+ populations in E15.5 control, Rps19lox/+ or Rpl5lox/+ embryos. (e) Western blot analysis of p53 and △-actin and quantification of p53 normalized to D-actin in FL- derived ckit+ cells from E15.5 control versus Rps19lox/+ embryos. (f) Western blot analysis of p53 and D-actin and quantification of p53 normalized to D-actin in FL- derived ckit+ cells from E15.5 control versus Rpl5lox/+ embryos. (g) Percentage of Annexin V+ cells as marker of apoptosis in E15.5 control, Rps19lox/+ or Rpl5lox/+ embryos. (h) Quantification of cellular ROS levels of cKit+ and Ter119+ populations as measured by CellROX dye in E15.5 control, Rps19lox/+ or Rpl5lox/+ embryos. (i) Quantification of ferrous iron levels of cKit+ and Ter119+ populations measured as by Fe2+ biotracker dye in E15.5 control, Rps19lox/+ or Rpl5lox/+ embryos. (j) Quantification of cellular lipid peroxidation level of cKit+ and Ter119+ populations measured by the ratio of oxidized and non-oxidized BODIPY dye in E15.5 control, Rps19lox/+ or Rpl5lox/+ embryos. All data are presented as mean ± standard deviation (*p<0.05, **p<0.01, ***p<0.001, ****p<0.0001).
Figure 6
Figure 6. Rescue of the hematopoietic defects in both RP insufficient models require the complete ablation of p53.
(a) Survival curves from control, Rps19lox/+, Rps19lox/+; p53lox/+, Rps19lox/+; p53lox/lox and p53lox/lox mice. (b) Light microscopy images highlighting the architecture and cellular composition of the bone marrow (BM) and spleen in control and Rps19lox/+; p53lox/+ mice at P21. (c) Spleen cellularity and quantification of terminal erythropoiesis by flow cytometry based on CD44/Ter119/FSC as markers of differentiation in control and Rps19lox/+; p53lox/+ mice at P21. (d) BM cellularity and quantification of terminal erythropoiesis by flow cytometry based on CD44/Ter119/FSC as markers of differentiation in control and Rps19lox/+; p53lox/+ mice at P21. (e) Red cell parameters at P21. Upper panel: red blood cells (RBC), hemoglobin (HGB), hematocrit (HCT). Lower panel: mean corpuscular hemoglobin concentration (MCHC), mean corpuscular volume (MCV), reticulocytes. (f) Quantification of the different HSPC populations in E17.5 control, Rps19lox/+, Rps19lox/+; Rps19lox/+, Rps19lox/+; p53lox/+, Rps19lox/+; p53lox/lox and p53lox/lox embryos expressed as a fold change relative to control. (g) Ter119+ cell counts and quantification of cells in S0 and S3 in E17.5 control, Rps19lox/+, Rps19lox/+; p53lox/+, Rps19lox/+; p53lox/lox and p53lox/lox embryos expressed as a fold change relative to control. (h) Genotype counts from Rpl5lox/+; p53lox/lox intercrossing. (i) Quantification of the different HSPC populations in E17.5 control, Rpl5lox/+, Rpl5lox/+; p53lox/+ and Rpl5lox/+; p53lox/lox embryos expressed as a fold change relative to control. (j) Ter119+ counts and quantification of cells in S0 and S3 in E17.5 control, Rpl5lox/+, Rpl5lox/+; p53lox/+ and Rpl5lox/+; p53lox/lox embryos expressed as a fold change relative to control. All data are presented as mean ± standard deviation (*p<0.05, **p<0.01, ***p<0.001, ****p<0.0001).
Figure 7
Figure 7
Role of RUNX1 in RPS19 haploinsufficiency. (a) Western blot analyses of RUNX1 expression in ckit+ cells from E17.5 control and Rps19lox/+ and Rpl5lox/+ embryos. (b) FL cellularity and quantification of the different HSPC populations in E17.5 control, Rps19lox/+, Rps19lox/+; Runx1lox/+ and Rps19lox/+; Runx1lox/lox embryos expressed as a fold change relative to control. (c) scATAC-seq UMAP of integrated E13.5 FL from control, Rps19lox/+ and Rps19lox/+; p53lox/+ cells with clusters identified by marker genes. (d) Density projection of cells on scATAC-seq UMAP from control, Rps19lox/+ and Rps19lox/+; p53lox/+ FL cells at E13.5. (e) Differential open chromatin regions are separated into more accessible group (upregulated) and less accessible group (downregulated). The GIGGLE score of 20 predicted transcription factors is displayed in each group. (f) Genome Browser snapshot of the ATAC-seq signal at the Cdkn1a gene locus in HSPCs. Runx1 binding motif (TGTGGT) is highlighted and bottom tracks are analyzed using Signac. (g) Western blot analysis of RUNX1, p53, p21 and RPS19 in FL-derived ckit+ cells from E17.5 control, Rps19lox/+, Rps19lox/+; Runx1lox/+ and Rps19 lox/+; Runx1lox/lox embryos. (h) Quantification of the western blots for p53 and p21 in Rps19lox/+, Rps19lox/+; Runx1lox/+ and Rps19lox/+; Runx1lox/lox ckit+ cells, normalized to control. (i) Western blot analysis of RUNX1, p53, p21 and RPS19 in FL-derived ckit+ cells from E17.5 control, Rps19lox/+, and Rps19lox/+; p53lox/lox embryos. (j) Violin plots depicting expression of RUNX1 within stem and progenitor cells from control (n=3) and DBAS (n=6) patients BM, analyzed ex vivo. N refers to total number of cells and the red dot indicates mean expression within each violin. (k) Capillary western blot analysis of RUNX1 and -actin in CD34+ cells from healthy donors and DBAS patients with a mutation in RPS17 or RPS19. All data are presented as mean ± standard deviation (*p<0.05, **p<0.01, ***p<0.001, ****p<0.0001).

References

    1. Kovalski J.R., Kuzuoglu-Ozturk D., and Ruggero D. (2022). Protein synthesis control in cancer: selectivity and therapeutic targeting. EMBO J 41, e109823. 10.15252/embj.2021109823. - DOI - PMC - PubMed
    1. Mazumder B., Li X., and Barik S. (2010). Translation control: a multifaceted regulator of inflammatory response. J Immunol 184, 3311–3319. 10.4049/jimmunol.0903778. - DOI - PMC - PubMed
    1. Storkebaum E., Rosenblum K., and Sonenberg N. (2023). Messenger RNA Translation Defects in Neurodegenerative Diseases. N Engl J Med 388, 1015–1030. 10.1056/NEJMra2215795. - DOI - PubMed
    1. Narla A., and Ebert B.L. (2010). Ribosomopathies: human disorders of ribosome dysfunction. Blood 115, 3196–3205. 10.1182/blood-2009-10-178129. - DOI - PMC - PubMed
    1. Farley-Barnes K.I., Ogawa L.M., and Baserga S.J. (2019). Ribosomopathies: Old Concepts, New Controversies. Trends Genet 35, 754–767. 10.1016/j.tig.2019.07.004. - DOI - PMC - PubMed

Publication types

LinkOut - more resources