. 2025 Oct 3;16(1):8831.
doi: 10.1038/s41467-025-63880-7.

MTCH2 modulates CPT1 activity to regulate lipid metabolism of adipocytes

Affiliations

MTCH2 modulates CPT1 activity to regulate lipid metabolism of adipocytes

Chunyan Wu et al. Nat Commun. .

Abstract

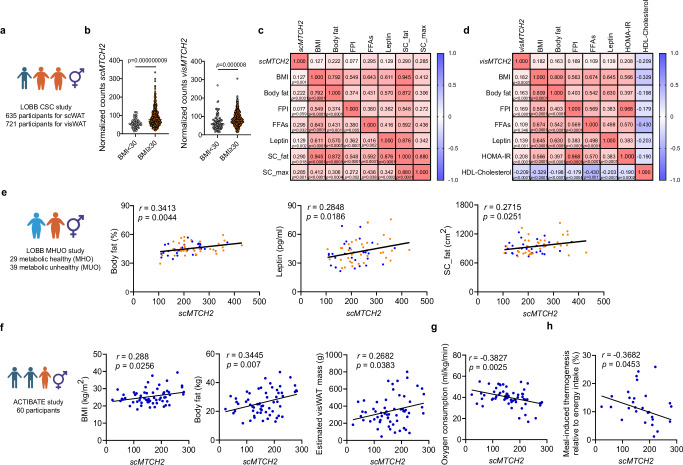
Metabolic disorders, including obesity and metabolic-associated steatohepatitis, arise from a chronic energy surplus. Thus, enhancing energy dissipation through increased respiration holds significant therapeutic potential for metabolic disorders. Through a comprehensive analysis of human and murine adipose tissues, along with a functional screen, we identify mitochondrial carrier homolog 2, a mitochondrial outer membrane protein, as a pivotal regulator of mitochondrial metabolism. Intriguingly, its expression in adipose tissue is a strong determinant of obesity in humans. Adipocyte-specific ablation of mitochondrial carrier homolog 2 improves mitochondrial function and whole-body energy expenditure, independent of uncoupling protein 1. Furthermore, mitochondrial carrier homolog 2 regulates mitochondrial influx of free fatty acids by modulating the sensitivity of carnitine palmitoyltransferase 1 to malonyl-CoA through direct physical interaction, leading to enhanced energy expenditure in adipocytes/adipose tissue. Here we show mitochondrial carrier homolog 2 functions as a negative regulator of energy metabolism in adipocytes and represents a potential target for treating obesity and related metabolic disorders.


Conflict of interest statement

Competing interests: S.K., B.S.H., A.P., and H.N. are full employees of Boehringer Ingelheim Pharma GmbH & Co. KG, 88397 Biberach an der Riss, Germany. The remaining authors declare no competing interests.

Figures

Fig. 1
Fig. 1. Identification of targets with potential to promote adipocyte function.
a Identification of 679 overlapping differentially expressed genes (DEGs; FDR adjusted p < 0.05) by cross-analyzing transcriptomes of paired supraclavicular brown adipose tissue (BAT) and adjacent subcutaneous white adipose tissue (scWAT) biopsies (n = 6, in green), human multipotent adipose-derived stem (hMADS) cells differentiated into white and beige adipocytes (n = 3, in yellow) and pure murine brown and white adipocytes (n = 5, in purple). be Mitochondrial respiration in hMADS differentiated beige adipocytes following knockdown of 110 candidate genes. Positive effects on mitochondrial respiration are depicted in blue, negative effects in gray. Genes significantly affecting b basal (n = 5 for each group), c dibutyryl cyclic adenosine monophosphate (cAMP)-stimulated (n = 4 for UQCRQ group and n = 5 for other groups), d cAMP-stimulated uncoupled (n = 4 for UQCRQ, UQCRC2 groups and n = 5 for other groups), and e maximal mitochondrial respiration (n = 4 for UQCRQ, ACADM groups and n = 5 for other groups) by more than 20% are shown. f Mitochondrial carrier homolog 2 (MTCH2) expression levels in human scWAT (in gray) and supraclavicular BAT (in blue) biopsies. n = 6 for each group. g The correlation of MTCH2 expression with UCP1, CIDEA, and COX7A1 in human scWAT and supraclavicular BAT biopsies. n = 12 for each group. h Mtch2 expression levels in mouse inguinal WAT (iWAT, in white), epididymal WAT (eWAT, in gray), and BAT (in blue). n = 4 for iWAT and eWAT, and n = 3 for BAT. Data are presented as mean ± SEM and analyzed using two-tailed Student’s t-test (bf) or a two-tailed Pearson test (g), or two-way ANOVA with Tukey’s post hoc multiple comparison test (h). Source data are provided as a Source data file.
Fig. 2
Fig. 2. Mitochondrial carrier homolog 2 (MTCH2) expression in humans is linked to a metabolic profile associated with obesity.
a Leipzig Obesity BioBank (LOBB) cross-sectional cohort (CSC) study, integrating clinical parameters with bulk RNA sequencing of subcutaneous white adipose tissue (scWAT) and visceral WAT (visWAT) (created in BioRender, https://BioRender.com/s1eg8w0). b MTCH2 expression between lean (body mass index (BMI) < 30, white circles) individuals and individuals living with obesity (BMI ≥ 30, orange circles) in scWAT (scMTCH2; n = 70 and 565 individuals, respectively) and in visWAT (visMTCH2; n = 96 and 625 individuals, respectively). c Correlation of scMTCH2 expression with various clinical parameters. BMI (n = 635); body fat (n = 613); FPI (fasting plasma insulin; n = 608); FFAs (free fatty acids; n = 53); leptin (n = 545); SC_fat (subcutaneous fat area; n = 66); SC_max (subcutaneous max adipocyte size; n = 130). d Correlation of visMTCH2 expression with various clinical parameters. BMI (n = 721); body fat (n = 691); FPI (n = 683); FFAs (n = 77); leptin (n = 625); HOMA-IR (homeostatic model assessment for insulin resistance; n = 615); HDL-cholesterol (high-density lipoprotein-cholesterol; n = 404). e LOBB metabolically healthy and unhealthy (MHUO) study (created in BioRender, https://BioRender.com/esvem6q). Correlation of scMTCH2 expression with body fat, leptin, and SC_fat in metabolically healthy (in blue; n = 29 individuals) versus unhealthy (in orange; n = 39 individuals) obesity cohorts. fh ACTIBATE young human study (created in BioRender, https://BioRender.com/z9lbecl). Correlation of scMTCH2 expression with f BMI, body fat, and estimated visWAT mass (n = 60 individuals), g relative oxygen consumption levels (n = 60 individuals), and h meal-induced thermogenesis relative to energy intake (n = 30 individuals). Data are presented as mean ± SEM and analyzed using two-tailed Student’s t-test (b), or a two-tailed Pearson test (ch). The exact p values for (c, d) are shown in the Source data file. Source data are provided as a Source data file.
Fig. 3
Fig. 3. Mitochondrial carrier homolog 2 (MTCH2) ablation enhances mitochondrial respiration in vitro and energy expenditure in vivo.
a The effects of MTCH2 knockdown (KD) on oxygen consumption rate (OCR) in human multipotent adipose-derived stem (hMADS) adipocytes. n = 8 for control group (siCtrl) in gray and n = 9 for MTCH2 KD group (siMTCH2) in orange. cAMP, dibutyryl cyclic adenosine monophosphate. b The effects of MTCH2 ablation on uncoupling protein 1 (UCP1) protein levels (n = 3 for each group, control group in gray and MTCH2 KD group in orange) in hMADS adipocytes. c The effects of Mtch2 ablation on mitochondrial respiration (n = 8 for each group, control group in gray and Mtch2 KD group in orange) in mature murine immortalized brown adipocytes (iBAs). Iso isoproterenol. d The effects of Mtch2 ablation on UCP1 protein levels (n = 6 for each group, control group in gray and Mtch2 KD group in orange) in iBAs. e Representative blots of MTCH2 and UCP1 protein levels in adipose tissue-specific Mtch2 knockout (KO) mice (Mtch2fl/flAdip-CreERT2; n = 4 for iBAT and n = 3 for iWAT). f, g Energy expenditure in mice. f Analysis of covariance (ANCOVA) of oxygen consumption/body weight (control group mice n = 5 in black; Mtch2 KO mice n = 6 in orange). g Average oxygen consumption under basal and CL-316,243 (CL, a thermogenic beta 3-agonist) injected conditions (control group mice n = 5 in gray; Mtch2 KO mice n = 6 in orange). h Mice body weight and food intake on a high-fat diet (HFD; control group mice n = 17 in gray; Mtch2 KO mice n = 13 in orange). i Mice body composition analysis using the EchoMRI after 13 weeks on an HFD (control group mice n = 17 in gray; Mtch2 KO mice n = 13 in orange).  j Intraperitoneal glucose tolerance test and area under the curve after 12 weeks on an HFD (control group mice n = 17 in gray; Mtch2 KO mice n = 13 in orange). Data are presented as mean ± SEM and analyzed using two-tailed Student’s t-test (ad, gj) or two-tailed ANCOVA (f). Source data are provided as a Source data file.
Fig. 4
Fig. 4. Mitochondrial carrier homolog 2 (MTCH2) regulates mitochondrial metabolism independently of mitochondrial dynamics in human adipocytes.
The effects of MTCH2 knockdown (KD) on cellular levels of individual oxidative phosphorylation (OXPHOS) proteins in a human multipotent adipose-derived stem (hMADS) adipocytes and b mature murine immortalized brown adipocytes (iBAs). n = 4 for each group, control group (siCtrl) in gray and MTCH2 KD group (siMTCH2) in orange. Representative blots (c) and quantification (d) of core indicated mitochondrial dynamics proteins in hMADS adipocytes with MTCH2 KD (n = 3 for each group, control group in gray and MTCH2 KD group in orange). Representative blots (e) and quantification (f) of core indicated mitochondrial dynamics proteins in iBAs with Mtch2 KD. DRP1 dynamin-related protein 1, OPA1 optic atrophy 1, MFN1 mitofusin-1, MFN2 mitofusin-2. n = 8 for MFN1, and n = 7 for all other groups (control group in gray and Mtch2 KD group in orange). g, h The effects of Mtch2 ablation on mitochondrial morphology in hMADS adipocytes and iBAs. Representative electron microscopy (EM) images are presented g in hMADS adipocytes and h iBAs. Scale bar, 5 µm. Experiments were repeated two times. Data are presented as mean ± SEM and analyzed using a two-tailed Student’s t-test. Source data are provided as a Source data file.
Fig. 5
Fig. 5. Mitochondrial carrier homolog 2 (MTCH2) deficiency increases fatty acid oxidation (FAO) in adipocytes.
a Representative blots and quantification of hormone-sensitive lipase (HSL) and its phosphorylation levels in human multipotent adipose-derived stem (hMADS) adipocytes with MTCH2 knockdown (KD). n = 3 for each group, control group (siCtrl) in gray and MTCH2 KD group (siMTCH2) in orange. Glycerol (b) and non-esterified fatty acids (NEFA) (c) levels in the medium of hMADS adipocytes with MTCH2 KD (n = 12 for each group, control group in gray and MTCH2 KD group in orange). d Representative blots and quantification of HSL and its phosphorylation levels in mature murine immortalized brown adipocytes (iBAs) with Mtch2 KD (n = 3 for each group, control group in gray and Mtch2 KD group in orange). Glycerol (e) and NEFA (f) levels in the medium of iBAs with mtch2 KD (n = 12 for each group, control group in gray and Mtch2 KD group in orange). Fuel dependency assay by oxygen consumption rate (OCR) (g) and its quantification (h) in hMADS adipocytes with MTCH2 KD. FA dependency assay, n = 5 for control group in gray and n = 8 for MTCH2 KD group in orange. Glucose dependency assay, n = 6 for control group in gray and n = 8 for MTCH2 KD group in orange. Glutamine dependency assay, n = 5 for control group in gray and n = 6 for MTCH2 KD group in orange. Fuel dependency assay (i) and its quantification (j) in iBAs with mtch2 KD (n = 11 for control group in gray and n = 8 for Mtch2 KD group in orange). k The FAO rates in hMADS adipocytes with MTCH2 KD (n = 8 for each group, control group in gray and MTCH2 KD group in orange). l The FAO rate in iBAs with mtch2 KD (n = 5 for each group, control group in gray and Mtch2 KD group in orange). Data are presented as mean ± SEM and analyzed using a two-tailed Student’s t-test. Source data are provided as a Source data file.
Fig. 6
Fig. 6. Mitochondrial carrier homolog 2 (MTCH2) interacts with carnitine palmitoyltransferase 1 (CPT1) to modulate its activity and regulate fatty acid oxidation (FAO) in adipocytes.
a Proteomics of mitochondria isolated from control and Mtch2 knockdown (KD) mature murine immortalized brown adipocytes (iBAs) (n = 4 for each group, differentially expressed proteins are highlighted in red). b, c CPT1 activities in the presence of different concentrations of malonyl-CoA in iBAs mitochondria. n = 5 for each group, control group (siCtrl) in gray and Mtch2 KD (siMtch2) group in orange. CPT1 activities in the presence of different concentrations of malonyl-CoA in d interscapular brown adipose tissue (iBAT) and e inguinal white adipose tissue (iWAT) mitochondria isolated from Mtch2fl/flAdip-CreERT2 knockout (KO in orange) and control littermates in gray. n = 4 for iWAT from Mtch2 KO mice at 0 µM malonyl-CoA, and n = 5 for other groups. f Malonyl-CoA levels in iBAT and iWAT from Mtch2fl/flAdip-CreERT2 (n = 10 in orange) and control littermates (n = 12 in gray). g, h Representative images of proximity ligation assay (PLA). Direct interaction between MTCH2 and CPT1A (g), and CPT1B (h) in iBAs. Scale bar, 20 µm. Experiments were repeated three times. i Co-immunoprecipitation conducted in HEK293T whole cell extract (WCE) via FLAG antibody. Experiments were repeated three times. Data are presented as mean ± SEM and analyzed using a two-tailed Student’s t-test. Source data are provided as a Source data file.
Fig. 7
Fig. 7. A schematic summary of mitochondrial carrier homolog 2 (MTCH2)-mediated effects on lipid metabolism and energy expenditure (created with BioRender, https://BioRender.com/xew2csf).
MTCH2 expression is positively correlated with obesity in human adipose tissues. MTCH2 interacts with carnitine palmitoyltransferase 1 (CPT1) to regulate CPT1 activity and lipid metabolism in adipocytes. Upon MTCH2 depletion (indicated by the light green background in the right panel), CPT1 becomes less sensitive to malonyl-CoA (M-CoA), resulting in increased fatty acid oxidation (FAO) in adipocytes and contributing to enhanced energy expenditure in adipose tissue. Red arrows on the right side indicate elevated CPT1 activity and FAO rates.

References

    1. GBD 2013 Risk Factors Collaborators et al. Global, regional, and national comparative risk assessment of 79 behavioural, environmental and occupational, and metabolic risks or clusters of risks in 188 countries, 1990-2013: a systematic analysis for the Global Burden of Disease Study 2013. Lancet386, 2287–2323 (2015). - PMC - PubMed
    1. Ikeda, K., Maretich, P. & Kajimura, S. The common and distinct features of brown and beige adipocytes. Trends Endocrinol. Metab.29, 191–200 (2018). - PMC - PubMed
    1. Cannon, B. & Nedergaard, J. Cell biology: neither brown nor white. Nature488, 286–287 (2012). - PubMed
    1. Ahmadian, M., Duncan, R. E., Jaworski, K., Sarkadi-Nagy, E. & Sul, H. S. Triacylglycerol metabolism in adipose tissue. Future Lipidol.2, 229–237 (2007). - PMC - PubMed
    1. Bódis, K. & Roden, M. Energy metabolism of white adipose tissue and insulin resistance in humans. Eur. J. Clin. Investig.48, e13017 (2018). - PubMed

MeSH terms

LinkOut - more resources