. 2025 Oct 3;15(1):34567.
doi: 10.1038/s41598-025-17989-w.

Physics of North Indian Ocean tropical cyclones

Affiliations

Physics of North Indian Ocean tropical cyclones

Vadlamudi Brahmananda Rao et al. Sci Rep. .

Abstract

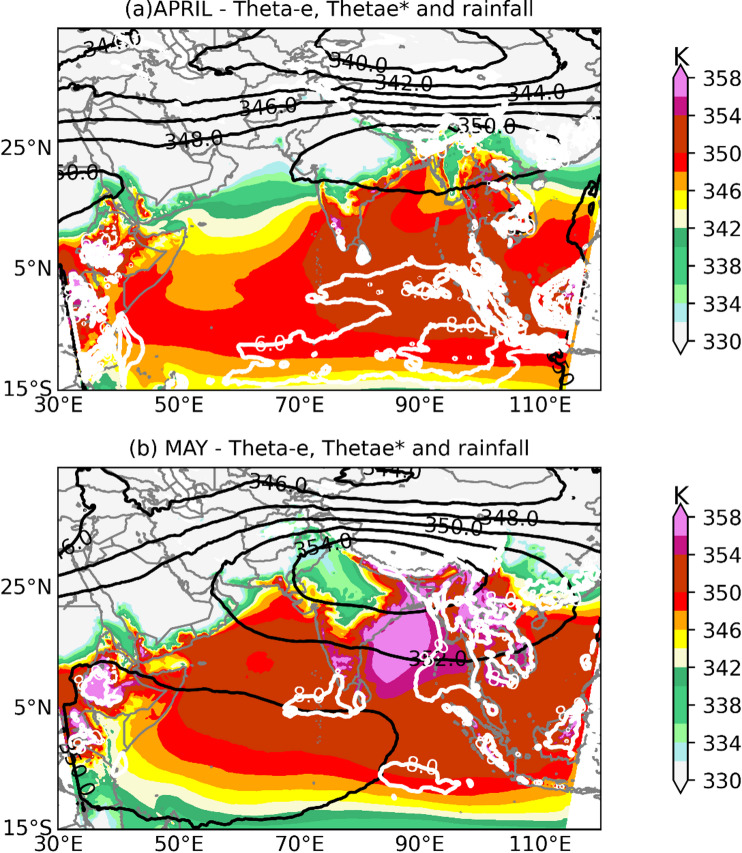
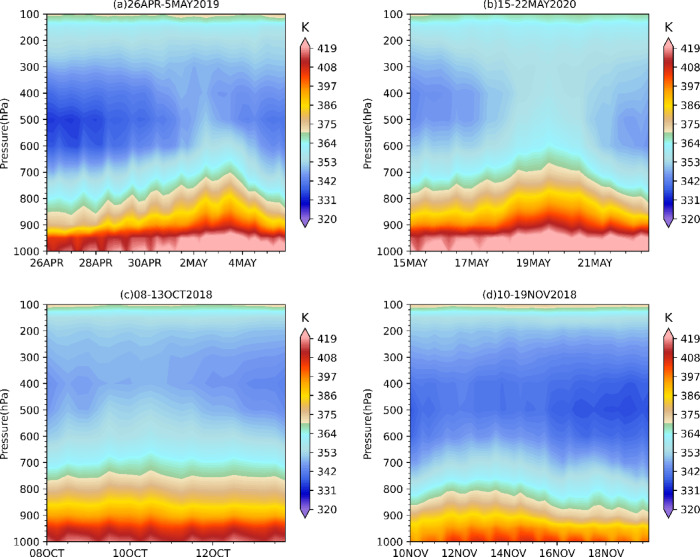
This research paper focuses on the applicability of two well-known concepts, Convective Quasi Equilibrium (CQE) and Convective Instability of the Second Kind (CISK), in the genesis of tropical cyclones (TCs), over the North Indian Ocean (NIO). Using high-resolution regional reanalysis IMDAA data from NCMRWF, we study the applicability of CQE and CISK during pre-monsoon (April and May) and post-monsoon (October and November) for the 1979 to 2020 period. In this study we found that CQE seems to be applicable over some regions of Arabian Sea (AS) in the pre-monsoon season only. However, TCs form over the entire AS, thus CISK mechanism may be vital in pre-monsoon over the AS. In post-monsoon season, over the Bay of Bengal (BB), CQE is found to be applicable. Also, we found the applicability of the CISK, over the BB, both in the pre- and post-monsoon seasons. The study of individual TCs confirms these results regarding the genesis mechanisms of TCs over NIO. Another important, feature we discovered over the AS is the strong, diurnal variation of humidity.


Conflict of interest statement

Declarations. Competing interests: The authors declare no competing interests.

Figures

Fig. 1
Fig. 1
Assessment of Convective Quasi-Equilibrium (CQE) over South Asia, (a) during April and (b) May. The black contour is the free tropospheric saturated equivalent potential temperature(formula image) vertically averaged between 200–400 hPa. The white contour indicates the region that has greater than 6 mm/day. (The formula image contours (black solid) ranging from 338 K to 350 with an interval of 2 K).
Fig. 2
Fig. 2
Same as Fig. 1, but for the post-monsoon months (a) October and (b) November. (The saturated equivalent potential temperature (formula image) contours (black solid) ranging from 338 K to 350 with an interval of 2 K)
Fig. 3
Fig. 3
In top panel, the Latitude-height cross-section of saturated equivalent potential temperature (formula image) anomalies overlayed by zonal winds (thick and dashed black) contours. Solid (dashed) contours are westerlies (easterlies). Bottom panel, the latitudinal variation of boundary layer potential temperature (formula image) and formula image along with rainfall.
Fig. 4
Fig. 4
Same as Fig. 3, but for the post-monsoon months of October (Left column) and November. In the figure top panel, the zonal winds contours are ranging from − 8 to + 8 m/s with 2 m/s interval.
Fig. 5
Fig. 5
Same as Fig. 1, but for the composite of the individual TC events irrespective of the category of the event. The formula image contours (black solid) ranging from 345 K to 360 K with an interval of 2 K)
Fig. 6
Fig. 6
Same as Fig. 2, but for the composite maps for the TC events over NIO irrespective of the category during post-monsoon months (a) October and (b) November. The formula image contours (black solid) ranging from 338 K to 350 K with an interval of 2 K).
Fig. 7
Fig. 7
Same as Fig. 3. But for the composite maps for the TC events over NIO irrespective of the category during the pre-monsoon season (a) April and (b) May. In the figure top panel the zonal winds contours are ranging from − 8 to + 8 m/s with 2 m/s interval.
Fig. 8
Fig. 8
Same as Fig. 4 But for the composite maps for the TC over NIO irrespective of the category during the post-monsoon season (a) October and (b) November. In the figure top panel, the zonal winds contours are ranging from − 8 to + 8 m/s with 2 m/s interval.
Fig. 9
Fig. 9
Vertical profiles of formula image, formula imagee, formula imagee* averaged over Arabain Sea (AS) region (10–25 N,60-75E]) during (a) April; (b) May; (c) October and (d) November.
Fig. 10
Fig. 10
Same as Fig. 9, but averaged over Bay of Bengal (BB, 10⁰-25⁰N, 85⁰-105⁰E).
Fig. 11
Fig. 11
Vertical profiles of specific humidity (q in g/kg) averaged over AS and BB regions during (a) April; (b) May; (c)October and (d) November.
Fig. 12
Fig. 12
Time-height cross-section of formula image during the pre- and post-monsoon individual cyclones over the Bay of Bengal. See Table 1 for more details.
Fig. 13
Fig. 13
Time-height cross-section of formula image during the pre- and post-monsoon individual cyclones over the Bay of Bengal. See Table 1 for more details.
Fig. 14
Fig. 14
Time-height cross-section of formula image the pre- and post-monsoon individual cyclones over the AS Arabian Sea. See Table 1 for more details.
Fig. 15
Fig. 15
Time-height cross-section of formula image during the pre- and post-monsoon individual cyclones over the Arabian Sea. See Table 1 for more details.

References

    1. Mohapatra, M., Bandyopadhyay, B. K. & Nayak, D. P. Evaluation of operational tropical cyclone intensity forecasts over North Indian ocean issued by India meteorological department. Nat. Hazards. 68, 433–451. 10.1007/s11069-013-0624-z (2013).
    1. Lange, S. et al. Projecting exposure to extreme climate impact events across six event categories and three Spatial scales. Ear Fut. 8 (12), e2020EF001616 (2020).
    1. Emanuel, K. The relevance of theory for contemporary research in atmospheres, oceans, and climate. AGU Adv.1 (2), e2019AV000129 (2020).
    1. Ooyama, K. A dynamical model for the study of tropical cyclone development. Geofisi Internac. 4, 187–198 (1964).
    1. Ooyama, K. V. Conceptual evolution of the theory and modelling of the tropical cyclone. J Met. Soc. Japan Ser. II. 60, 369–380 (1982).

LinkOut - more resources